
Cryptocurrency
Trading Bitcoin: Complacency Stage?
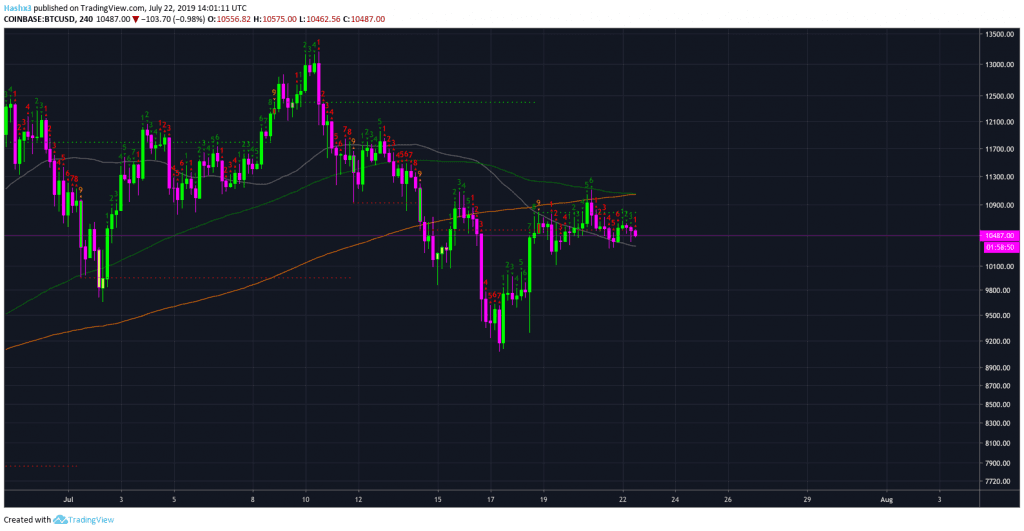
Complacency Stage? Are we in the Complacency Stage? Bitcoin was recently rejected at $11k. On the 4 hour chart above, you can see Bitcoin was rejected by the 128MA (green). Additionally, the sequential indicator on the 4 hour chart has flipped to a red 1. If price closes below $10.4k and creates a red 2 […]
Complacency Stage?
Are we in the Complacency Stage? Bitcoin was recently rejected at $11k. On the 4 hour chart above, you can see Bitcoin was rejected by the 128MA (green). Additionally, the sequential indicator on the 4 hour chart has flipped to a red 1. If price closes below $10.4k and creates a red 2 below a red 1, that is an indication to get out of your position or enter a short trade with a stop loss at $10.7k. As of now, Bitcoin’s primary support on the 4 hour is the 50MA (grey) at $10.3k.
Daily
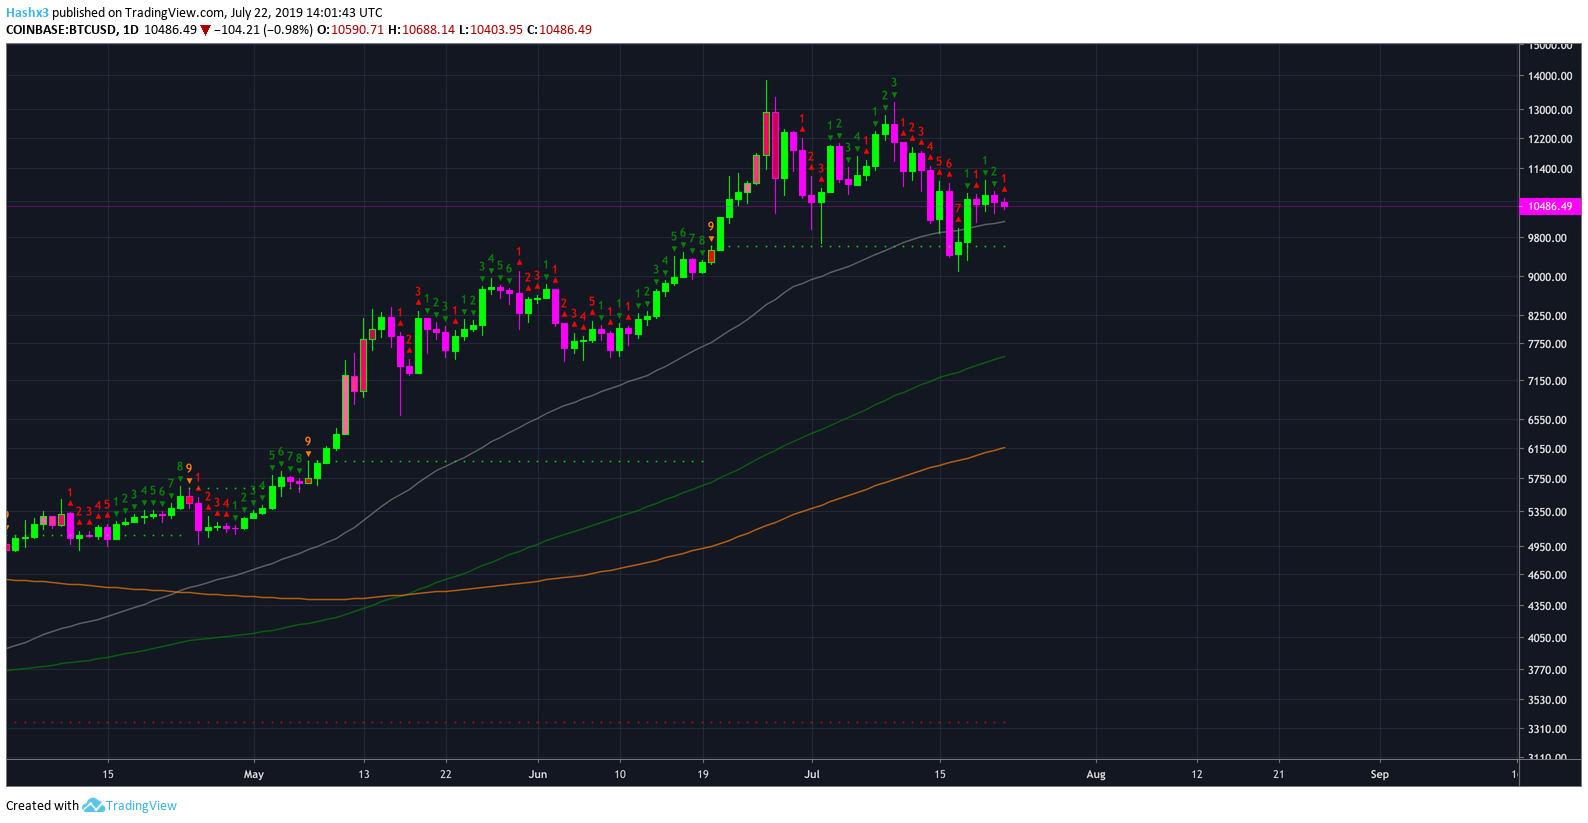
The TD Sequential indicator is in a ‘no trade zone’ on the daily chart above. Price is now on a red 1. According to sequential theory, green and red 1’s are considered to be in a ‘no trade zone’. Instead, it’s better to wait for confirmation of a green or red 2. If price gives us a red 2 closing below a red 1 tomorrow, look for a potential short trade based on sequential. However, Bitcoin still has a cluster of support at $9.5k with the 50MA (grey), the sequential set up trend line, and the 0.382 fibonacci level all acting as support. While price action, trend structure, and sequential are providing bearish signals, Bitcoin still has a strong cluster of support at $9.5k. If this level is purged, look for more downside potential.
Weekly
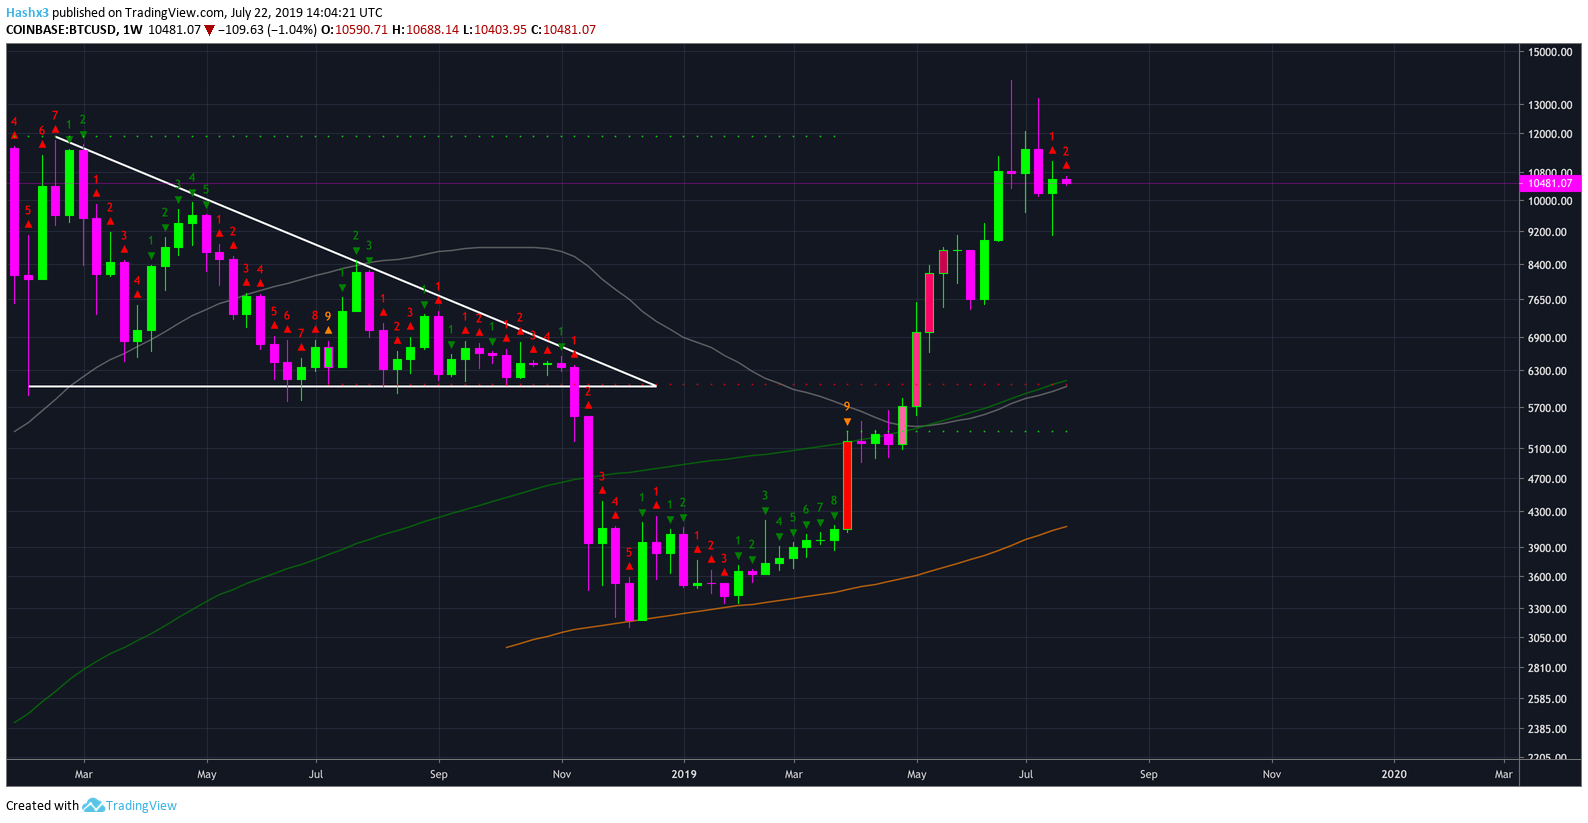
The sequential indicator has recently undergone a price flip on Bitcoin’s weekly chart above. If price closes below last week’s low of $9.1k, that will be a severely bearish indicator for the next 1-2 months.
Trend Structure and Market Sentiment
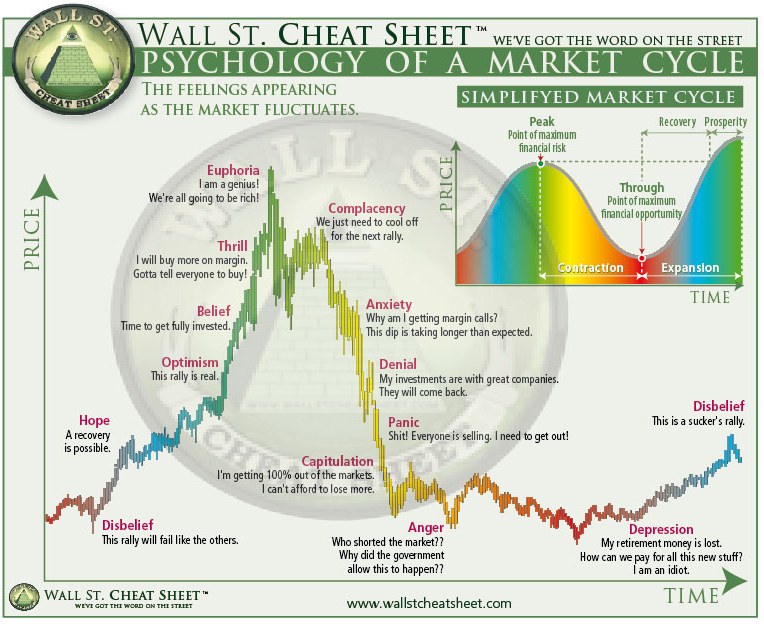
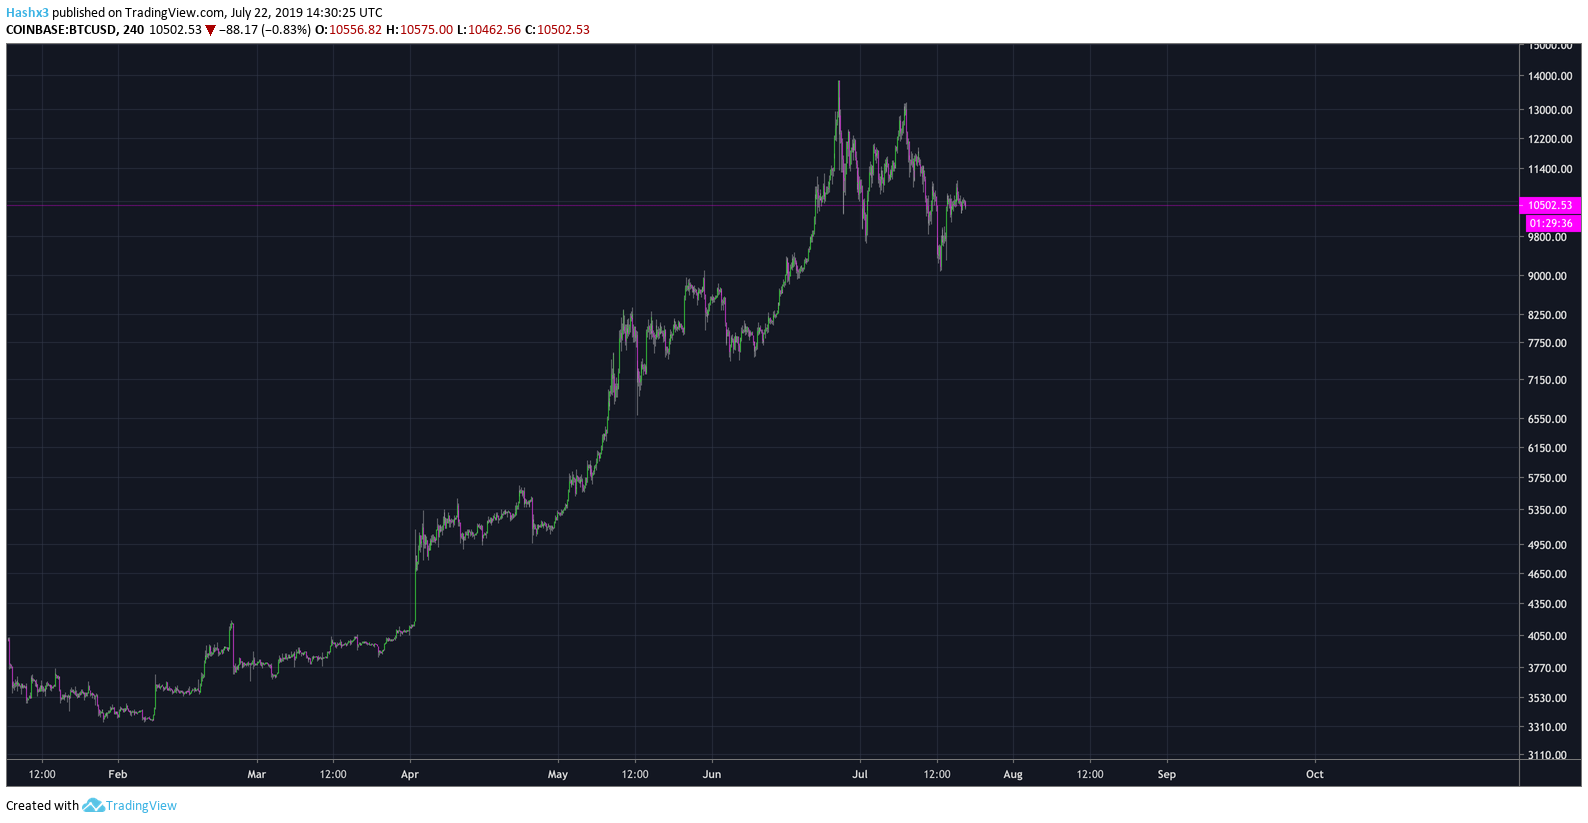
We’ve all seen the highlighted chart above. That being said, many fail to recognize the dangerous pattern Bitcoin may fall into. Throughout the spring rally, Bitcoin experienced an unprecedented run. When price increases at a parabolic rate, the trend typically tops, creates a lower high, then a parabolic dump follows before consolidation. Bitcoin’s daily chart above looks dangerously close to repeating this bubble pattern.
Conclusion
Are we in the Complacency Stage? Bitcoin is still in a bearish structure. Bitcoin has to break above resistance at $11k in order to regain bullish momentum. As of now, it appears Bitcoin will experience more bearish momentum in the short-term. Critical support remains at $9.5k and $9k.