
Cryptocurrency
Trading Bitcoin: Dead Cat Bounce? Lower Lows Incoming?
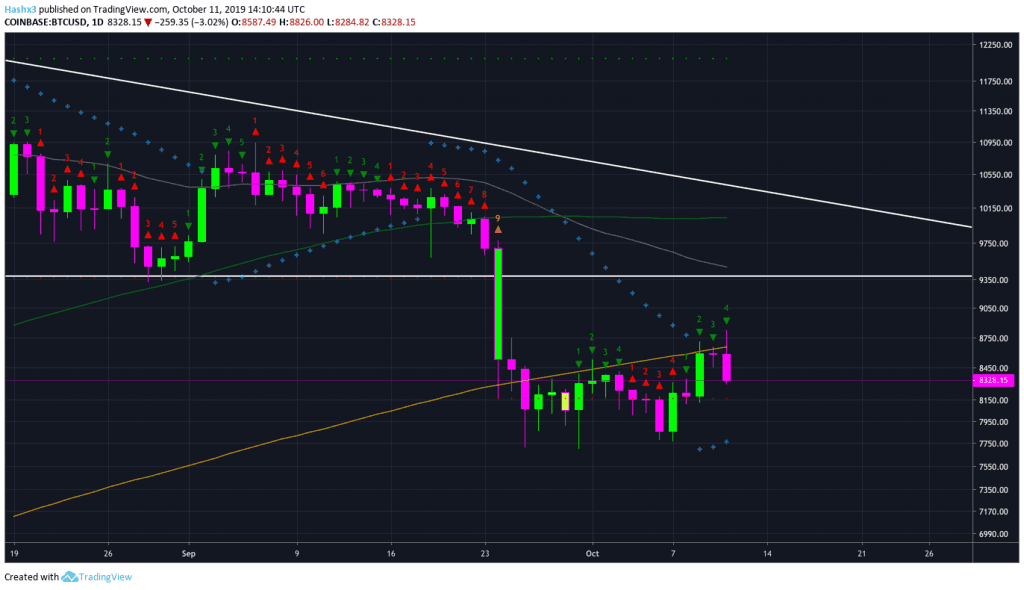
Dead Cat Bounce? Yesterday’s price increase is beginning to look more like a dead cat bounce as opposed to a legitimate rally. On the daily chart above, Bitcoin is on a bullish sequential 4. However, the bulls continue to be rejected by the 200MA (orange). In yesterday’s article, we noted that the 200MA (orange) was […]
Dead Cat Bounce?
Yesterday’s price increase is beginning to look more like a dead cat bounce as opposed to a legitimate rally. On the daily chart above, Bitcoin is on a bullish sequential 4. However, the bulls continue to be rejected by the 200MA (orange). In yesterday’s article, we noted that the 200MA (orange) was going to be a critical battle between the bulls and bears. Also, the 50MA (grey) has already crossed below the 128MA (green) and it will probably cross below the 200MA (orange). In classical technical analysis, this is known as a death cross which is indicative of a bearish continuation pattern. That said, moving averages are lagging indicators which means we have to estimate where they will go before they actually get there.
4 Hour
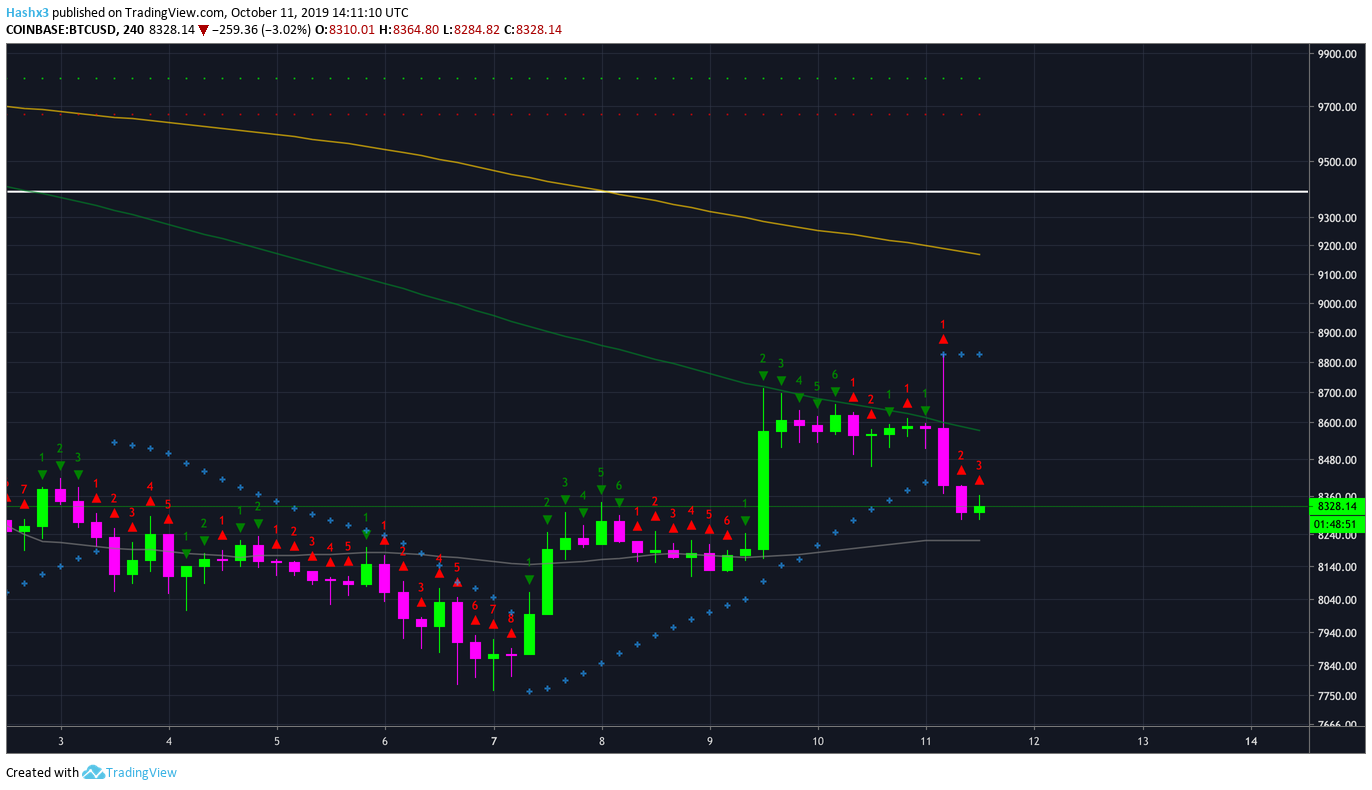
On the 4 hour chart above, Bitcoin is on a red 3 of 9 candle. As you can see above, price was rejected by the 128MA (green) and is now testing downward toward the 50MA (grey). Additionally, the Lucid SAR (blue x) has shifted into a bearish position above price which will now act as resistance. If you were trading based off sequential, you would have entered a short trade on the red 2. If you decided to place this trade, you would still be in it, and depending on your risk tolerance, you would set a stop loss at the 128MA (green).
BitMEX Funding and Premium Index
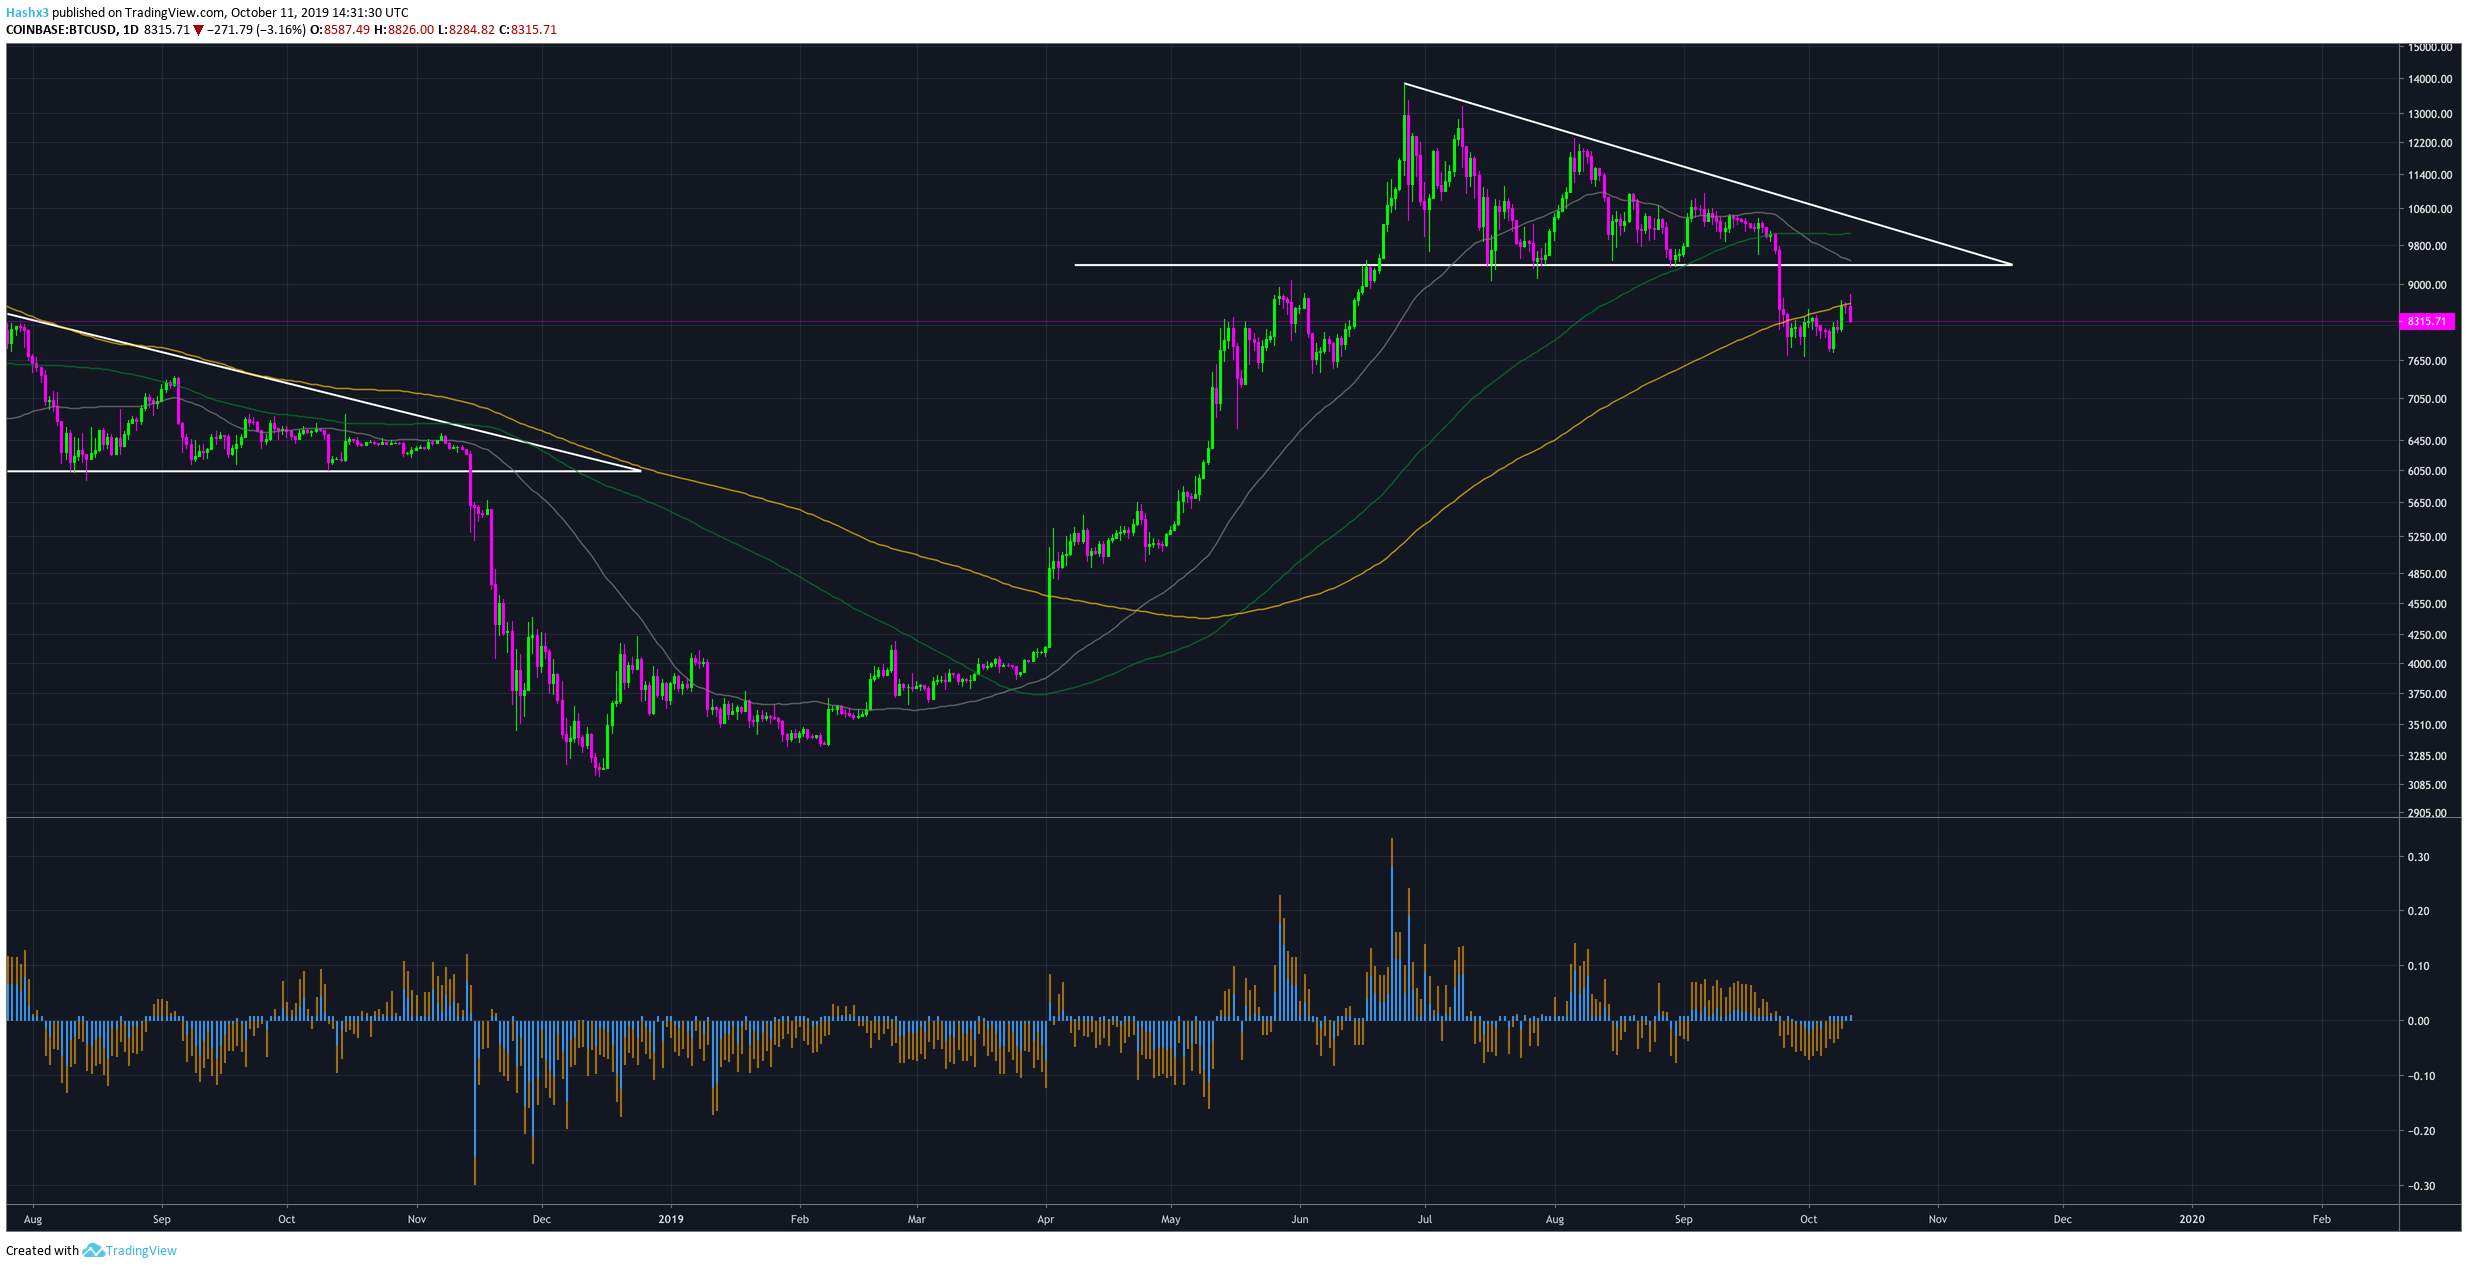
Ever since Bitcoin broke the descending triangle, the BitMEX Funding and Premium Index has been bullish. However, for the first time since $9k, the index is now in neutral-bearish territory. The Funding and Premium Index has been a reliable counter-indicator for the market as a whole throughout the past year.
Conclusion
Yesterday’s reaction rally looks like a dead cat bounce. Price is still neutral on the daily chart. The 4 hour chart is providing heavily bearish signals. The bulls and bears continue to battle over the daily 200MA. Bitcoin is much more bearish now that the bulls were rejected at $8.8k. As price consolidates, it is likely Bitcoin will continue to decrease in the short term.