
Cryptocurrency
Trading Bitcoin: Descending Triangle Becoming More Prevalent
Descending Triangle Becoming More Prevalent On the daily chart above, Bitcoin is in danger of falling into a descending triangle formation. In classical technical analysis, descending triangles break to the downside 70% of the time. Currently, Bitcoin is on a green 2 of 9 candle on the daily chart above. Therefore, if our current green […]

Descending Triangle Becoming More Prevalent
On the daily chart above, Bitcoin is in danger of falling into a descending triangle formation. In classical technical analysis, descending triangles break to the downside 70% of the time. Currently, Bitcoin is on a green 2 of 9 candle on the daily chart above. Therefore, if our current green 2 candle closes above yesterday’s green 1 candle, then a long trade is activated with a target of $11k. While sequential may be bullish, the trend remains bearish until the bulls can break above the 50MA (gray) on the daily chart above.
4 Hour
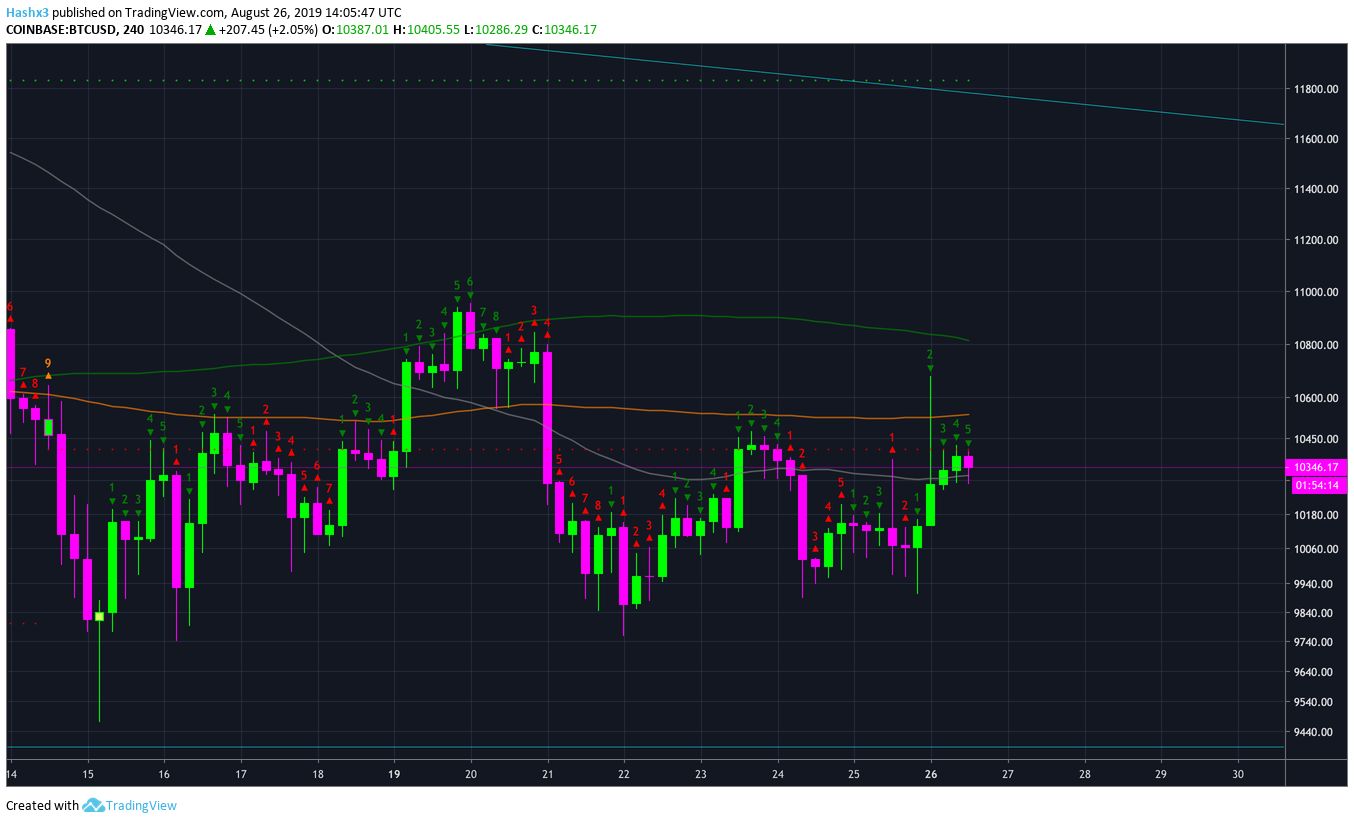
Bitcoin is on a green 5 of 9 candle on the 4 hour chart above. As of now, the 4 hour chart is relatively neutral and will probably flip to a red 1 in the next 12 hours. Most notably, the bulls were able to break above the 50MA (gray) which recently experienced a bearish death cross. That being said, the bulls must sustain the 50MA (gray) support level if bullish price action should continue. Currently, the bulls are battling to break above the sequential setup trend line (red dotted line) at $10.4k.
15 Min Chart Sequential Trading
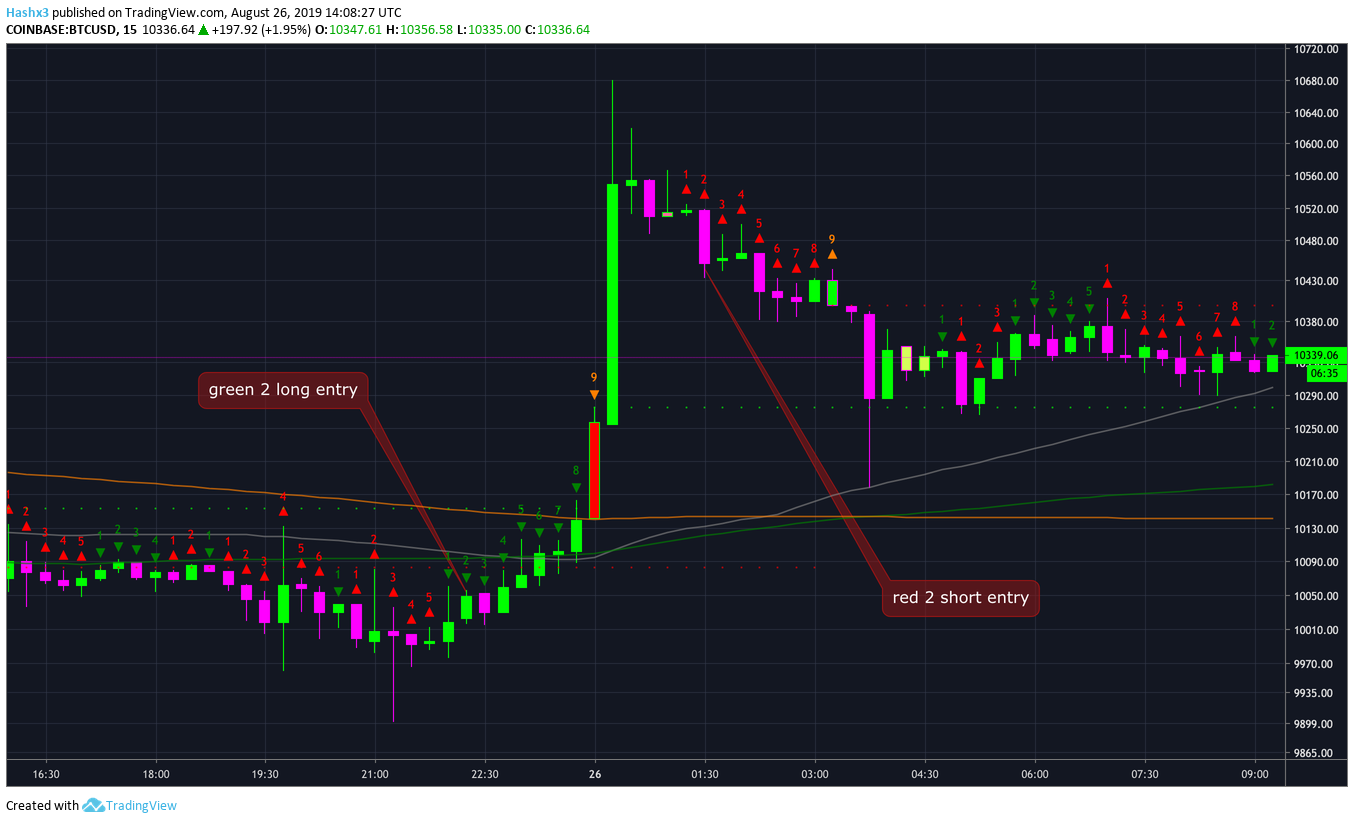
Recently, the sequential indicator has been very effective on the 15 min time frame. From the chart above, you can see the entries of both a short and long trade. The long trade was activated with a green 2 candle closing above the previous green 1 candle. Presumably, you would have exited that long trade when sequential reached a green 9. In addition, a short trade was activated with a red 2 closing below the previous red 1, following a green 9. In sequential theory, it is ideal to enter a trade on either a green or red 2 following a 9 of the opposite color. This usually means the momentum of the trend is changing and, probabilistically, an opportunity will emerge.
The Critical Difference Between a Bull and Bear Market
In order for a bull market to occur, outside money must enter the market. Price cannot increase drastically until there is “new meat” in the market. However, bear markets are much different. In fact, money does not have to leave the space for price to crash. All that is required for a market crash is for buyers to remove their bids. When there are simply no bulls who want to buy at a particular price, holders panic sell & the market crashes.
So how does this relate to Bitcoin?
In our current circumstances, Bitcoin experienced a parabolic run up over the spring of 2019. During this run up, there were no significant corrections and no subsequent support was formed. Therefore, if price falls below $9.5 or $9.2k, it may shake out the bulls who bought at $12k-$14k. While this situation has yet to occur, the current descending triangle formation projects a downside target in the $8k-$9k price region.
Conclusion
Bitcoin is on a green 2 candle on the daily chart. If the current green 2 closes above its prior green 1 candle, then a long trade with a target of $11k is activated. However, the bulls will most likely be rejected by the descending trend line or the sequential setup trend line. While the daily sequential is bullish, the overall posture of the trend remains bearish with a 2 week target in the $8-$9.5k price region.