
Cryptocurrency
Trading Bitcoin: Descending Triangle Finally Breaks!
Descending Triangle Finally Breaks! Ah, the descending triangle: The pattern Bitcoin traders all know and fear. For the past 2 months, we have been watching Bitcoin and noting the downward price action of a potential descending triangle. We even published an article on September 9th titled, Descending Triangle Will Send Us to $8k. According to […]

Descending Triangle Finally Breaks!
Ah, the descending triangle: The pattern Bitcoin traders all know and fear. For the past 2 months, we have been watching Bitcoin and noting the downward price action of a potential descending triangle. We even published an article on September 9th titled, Descending Triangle Will Send Us to $8k. According to classical technical analysis, descending triangles break to the downside 70% of the time. From the chart above, you can see that Bitcoin fell into this lethal pattern at both $6k and $9.5k. Yesterday, we finally experienced a breakdown after three months of repeated lower highs.
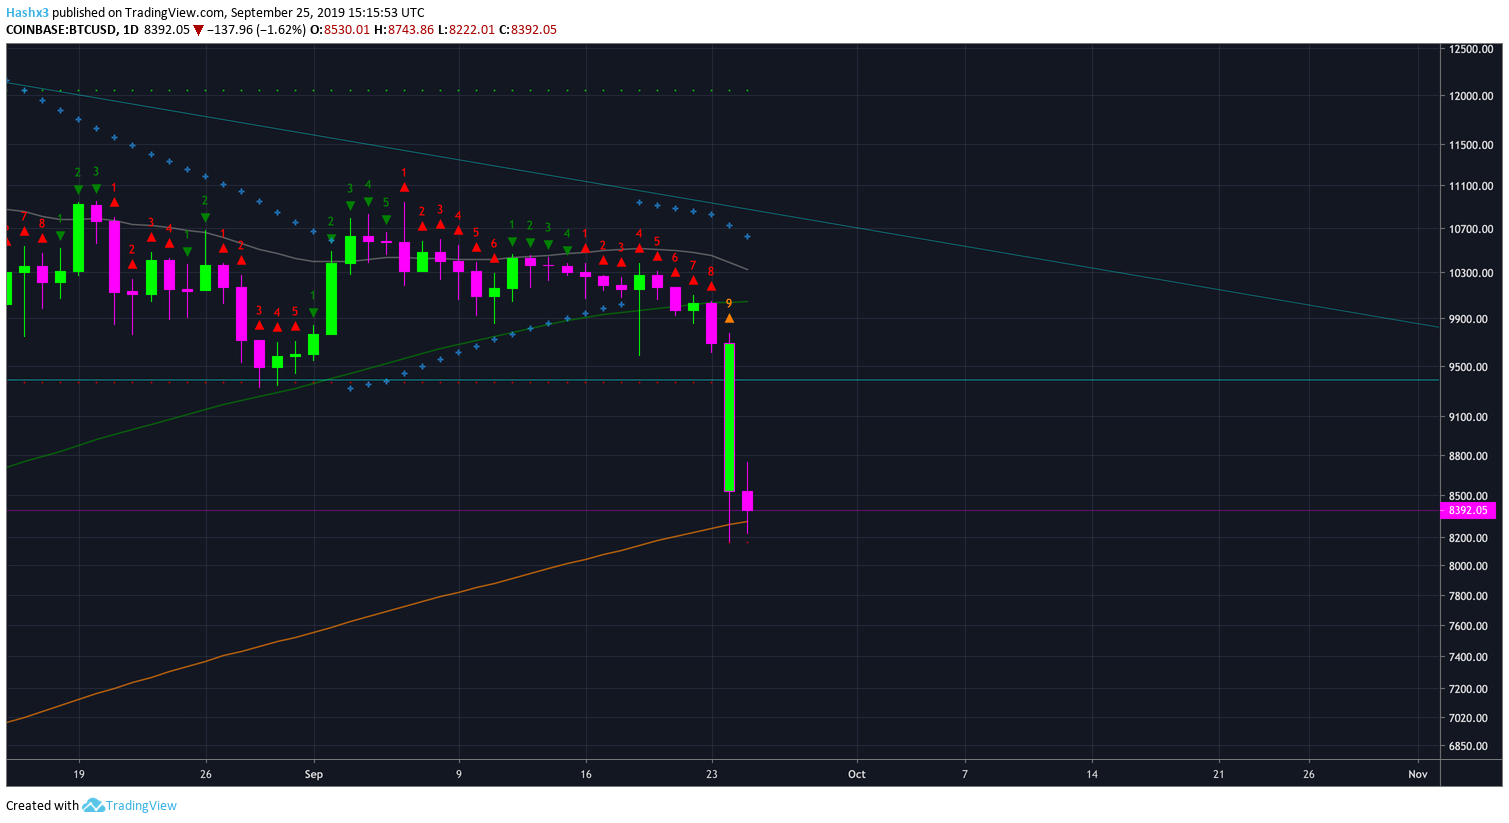
Daily
On Bitcoin’s daily chart above, you can see price dropped after reaching a red 9. Earlier this week, price gave us a red 2 candle closing below the previous red 1 candle. In sequential theory, a red 2 closing below the previous red 1 is an indication to place a short trade. If you were trading based off sequential you would sitting in a very lucrative short position with more potential downside price action. Additionally, price has found support just above the 200MA (orange) at $8.4k.
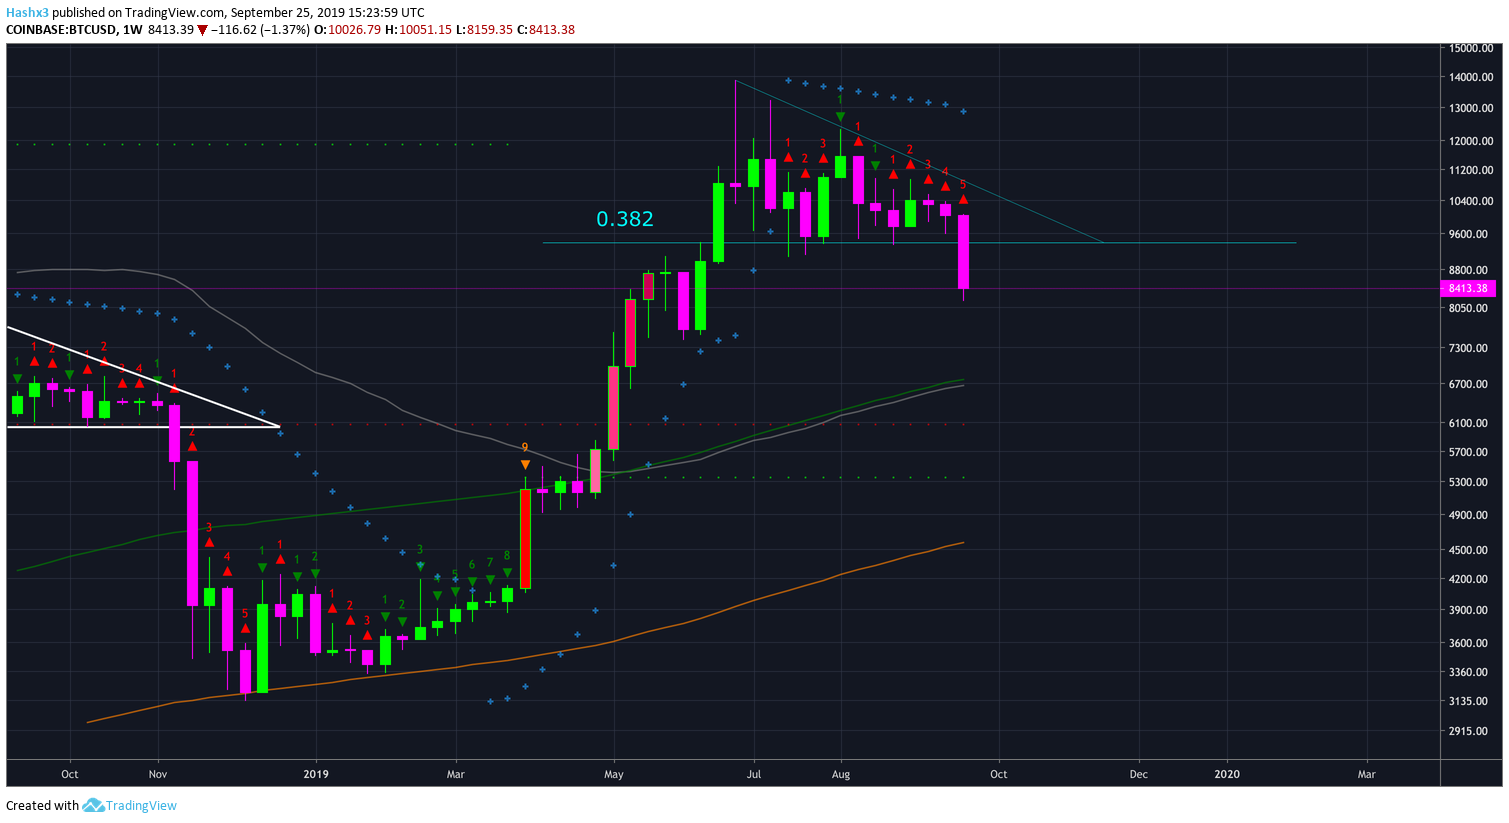
Weekly
Bitcoin’s weekly chart is much more bleak. The first significant support level does not appear until we reach the moving averages at a price of roughly $6.7k. Therefore, the next two weeks may have more downward potential for price action. That being said, it’s difficult to know where massive buying momentum will enter the market. Because of the lack of support, it is difficult to know exactly where Bitcoin will find support. However, the moving averages give us a glimpse of where price may land.
CME Group Launches Bitcoin Options!
Finally we will have the ability to buy Bitcoin Options through the CME in 2020. Why is this so instrumental for Bitcoin traders? – Because now, as options traders, we can implement strategies which were not previously possible. For example, at Market Rebellion we teach the stock replacement options strategy. This is the only investment vehicle in existence which enables a trader to lock in profits without decreasing the size of their position. In crypto bull markets, Bitcoin could increase 200%, or it could increase 2,000%. Therefore, with the stock replacement strategy, a trader would be able to lock in profits during a bull run, but they would not have to decrease their exposure to the underlying asset (Bitcoin). Enroll in our course and learn how to execute the stock replacement strategy before Bitcoin Options officially launch!
Conclusion
Bitcoin’s descending triangle has finally broken. For now, price is finding support at the 200MA at $8.3k. Good buying opportunities are likely to continue into the near future.
Disclaimer: The author of the article trades and hodls BTC.