
Cryptocurrency
Trading Bitcoin: Descending Triangle Will Send Us to $8k
Descending Triangle Will Send Us to $8k After a week of neutral chop, Bitcoin is consolidating at a price of roughly $10.3k. While price action has remained neutral, Bitcoin is falling into a pattern which many crypto traders know all too well. (That’s right, we’re talking about the descending triangle). After crashing from $20k, Bitcoin […]

Descending Triangle Will Send Us to $8k
After a week of neutral chop, Bitcoin is consolidating at a price of roughly $10.3k. While price action has remained neutral, Bitcoin is falling into a pattern which many crypto traders know all too well. (That’s right, we’re talking about the descending triangle). After crashing from $20k, Bitcoin created a series of lower highs with a base at $6k. This series of lower highs formed a descending triangle at $6k which eventually broke and led to a price decline of over 50%. In classical technical analysis, descending triangles break to the downside 70% of the time.
Now, our current market conditions are exactly the same, however, this time the base is at $9.4k (also the 0.382 fibonacci level). At our current time, Bitcoin is over halfway through the descending triangle, meaning there is a 70% chance price will break below $9.4k and continue to drop further. While many bulls are optimistic after the spring rally, Bitcoin is lining up for another +40% correction within the next 1-2 months. A correction of this magnitude would likely shake out any retail trader who bought at $11k-$14k.
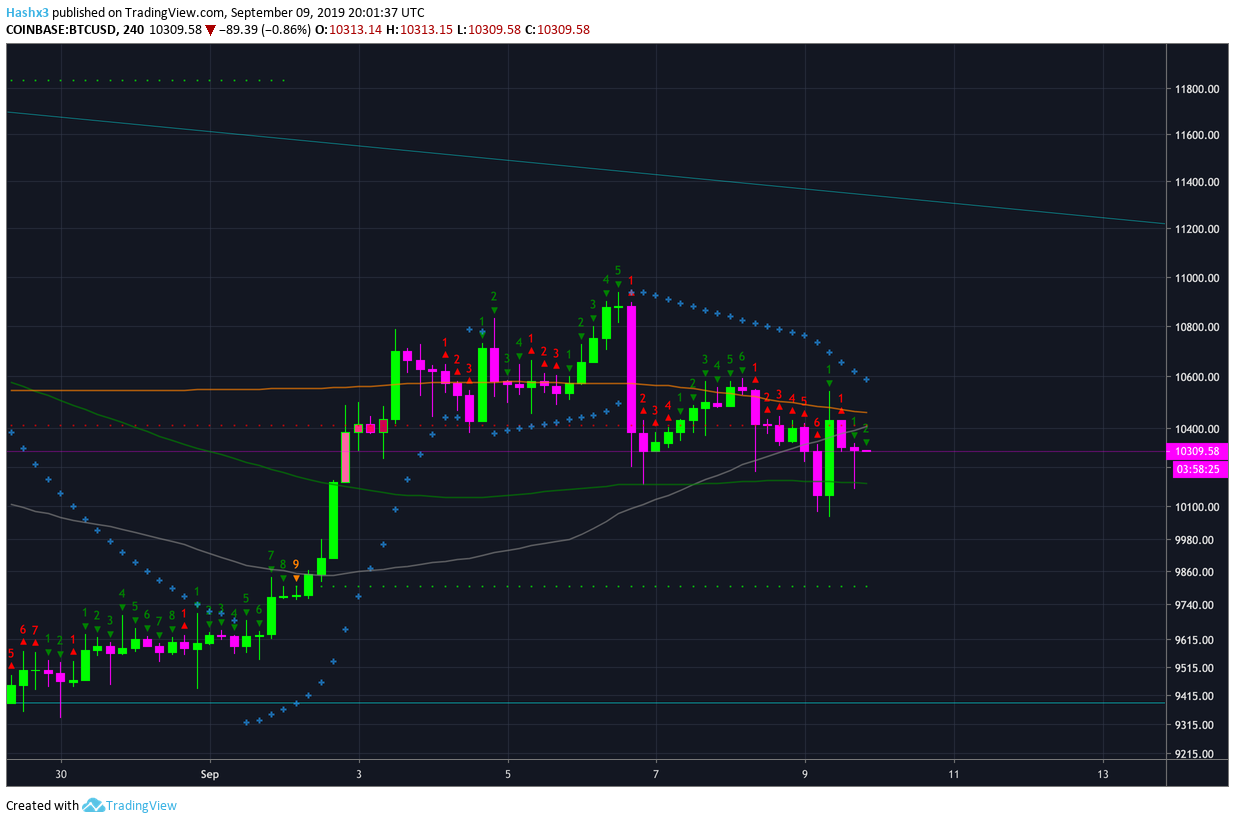
4 Hour
Bitcoin’s 4 hour chart above does not give us any immediate signal to place a trade. That being said, the 4 hour sequential indicator is currently on a green 2 candle. In sequential theory, a green 2 closing above the previous green 1 candle is a signal to place a long trade. However, we prefer to wait until the Lucid SAR (blue x’s) provides confirmation by flipping into a bullish support position. So far, price has not given us this confirmation and the Lucid SAR is still acting as bearish resistance at roughly $10.6k. As of now, Bitcoin remains in a no-trade zone on the 4 hour chart.
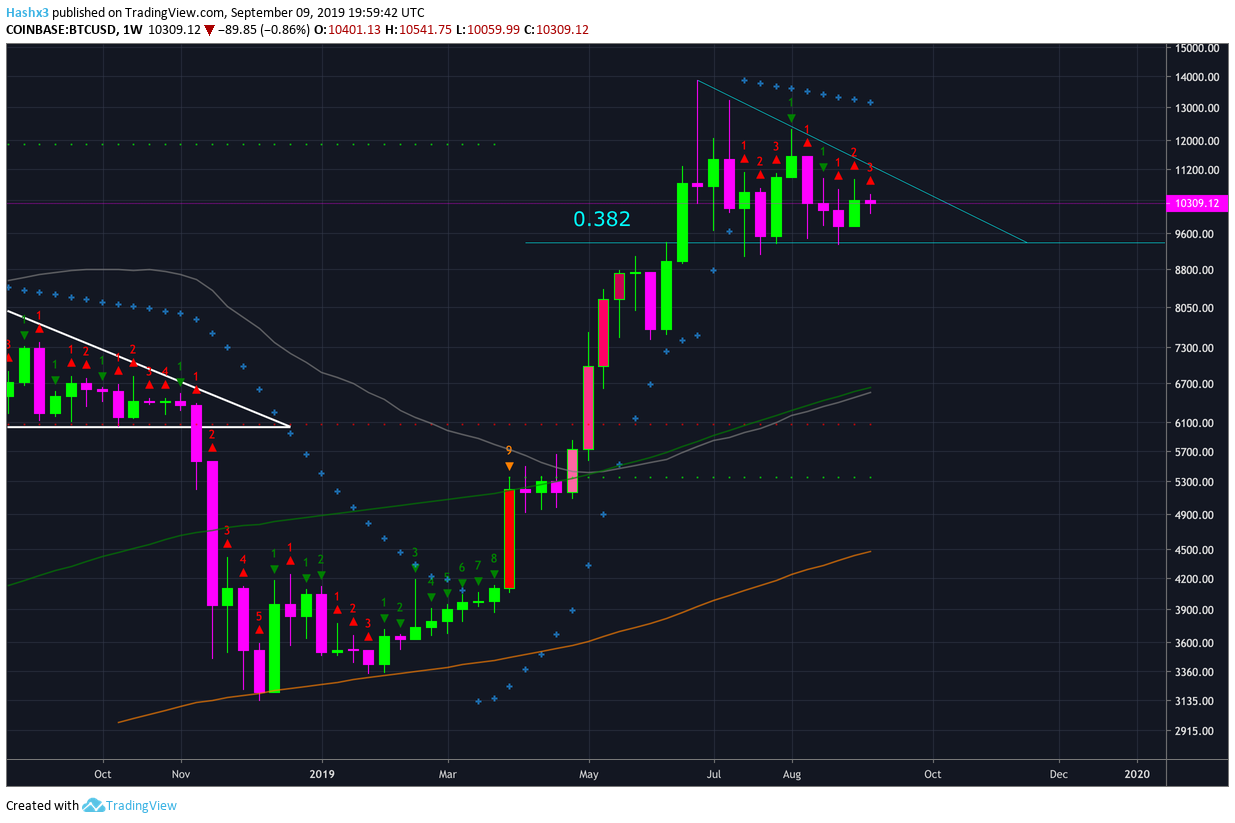
Weekly
The weekly chart above is currently on a red 3 candle. Unfortunately, the trend is entirely neutral based on weekly sequential. However, if price should break below the 0.382 fibonacci level, the first level of weekly support is the 128MA (green) located in the $7k-$8k price region.
Conclusion
Bitcoin is in a descending triangle which crypto traders know all too well. While the descending triangle is around three quarters of the way finished, it may take until late September / early October to break down. If price falls into the $7k-$8k price region, that would present an ideal time to buy the dip.
In reflection, trading based on technical analysis (utilizing descending triangles) is much more effective for Bitcoin as opposed to traditional markets or Foreign Exchange ECNs. This is because traditional markets are much more reactive to news or presidential tweets. Regardless of what negative comment emerges out of Donald Trump’s twitter account, it is unlikely that Bitcoin’s price will be affected.
BTCUSD Chart by TradingView
Disclaimer: The author of the article hodls Bitcoin.