
Cryptocurrency
Trading Bitcoin: Fall From $9.2k, Now What?
Fall From $9.2k, Now What? On the daily chart above, Bitcoin has fallen from $9.2k to find support at the 50MA (grey). For the past few weeks, we have been mentioning how important the 200MA (orange) has been as a support level throughout the entire spring and summer uptrend. In fact, Bitcoin has rarely, if […]
Fall From $9.2k, Now What?
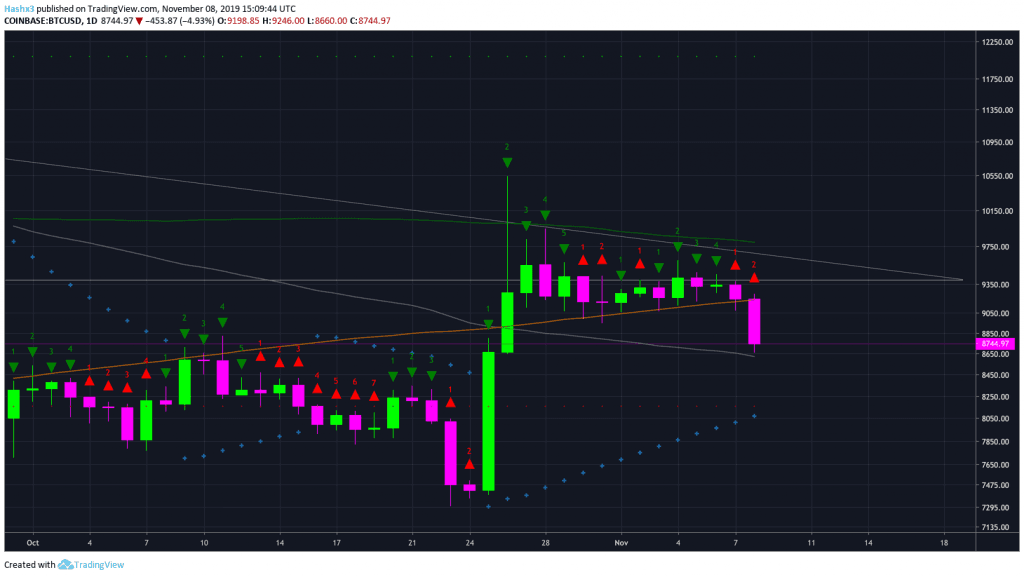
On the daily chart above, Bitcoin has fallen from $9.2k to find support at the 50MA (grey). For the past few weeks, we have been mentioning how important the 200MA (orange) has been as a support level throughout the entire spring and summer uptrend. In fact, Bitcoin has rarely, if ever, fallen below the 200MA during a bull market. Now that price has fallen below this key support level, the bulls are in some trouble. However, price seems to be finding support at the 50MA (grey). Additionally, the sequential indicator has given us a red 2 candle. In sequential theory, a red 2 closing below the previous red 1 is an indication to place a short trade. However, the Lucid SAR is still in a bullish support position below price. Before placing a trade, we look for confluence between both the sequential indicator and the Lucid SAR.
4 Hour
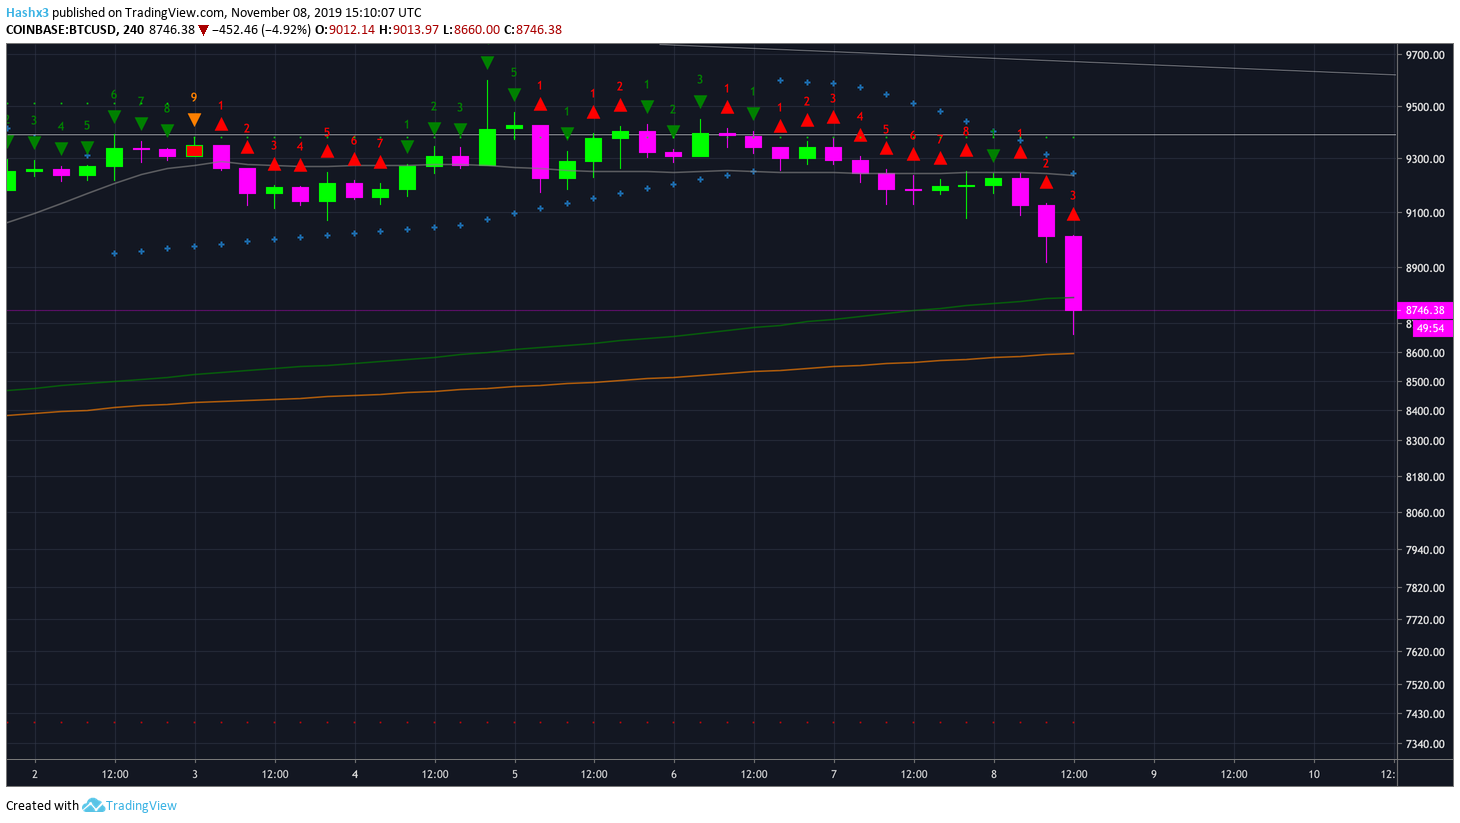
A short trade was activated on the 4 hour chart when our last red 2 candle closed below the previous red 1 candle. Also, the Lucid SAR (blue x) is in a bearish resistance position above price. Therefore, we now have confluence between both the sequential indicator and the Lucid SAR. For now it appears Bitcoin has found support at the 200MA (orange) on the 4 hour.
Conclusion
Bitcoin has finally seen some price action! While our recent price decrease has taken us down to a prior support level, Bitcoin has created a higher low in the continuation of the uptrend. However, Bitcoin must not fall below the 50MA (grey) on the daily and the 200MA (orange) on the 4 hour. For now price remains neutral – bearish.