
Cryptocurrency
Trading Bitcoin: Fibonacci Resistance Barely Holding
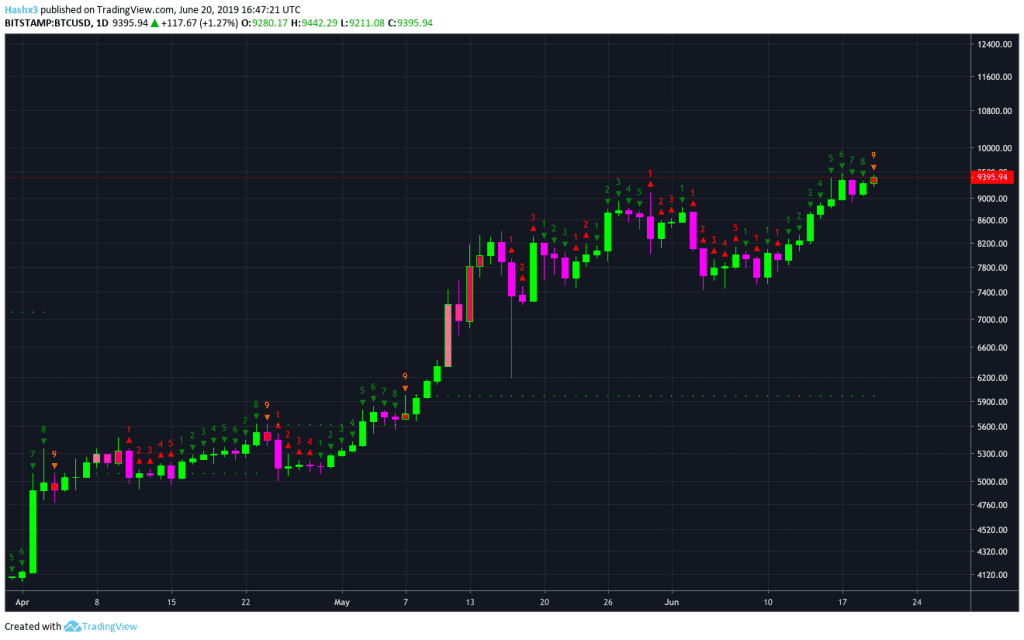
Trading Bitcoin: Fibonacci Resistance Barely Holding Currently, Bitcoin is trading at $9.3k and is continuing to retest resistance at $9.4k. On the daily chart above, Bitcoin is on a sequential green 9 candle. Therefore, a trend reversal is likely to occur within the next day or two. If price closes below the previous green 9 […]
Trading Bitcoin: Fibonacci Resistance Barely Holding
Currently, Bitcoin is trading at $9.3k and is continuing to retest resistance at $9.4k. On the daily chart above, Bitcoin is on a sequential green 9 candle. Therefore, a trend reversal is likely to occur within the next day or two. If price closes below the previous green 9 candle and records a red 1, look for a red 1 to 4 correction over the next four days.
Fibonacci Resistance Barely Holding
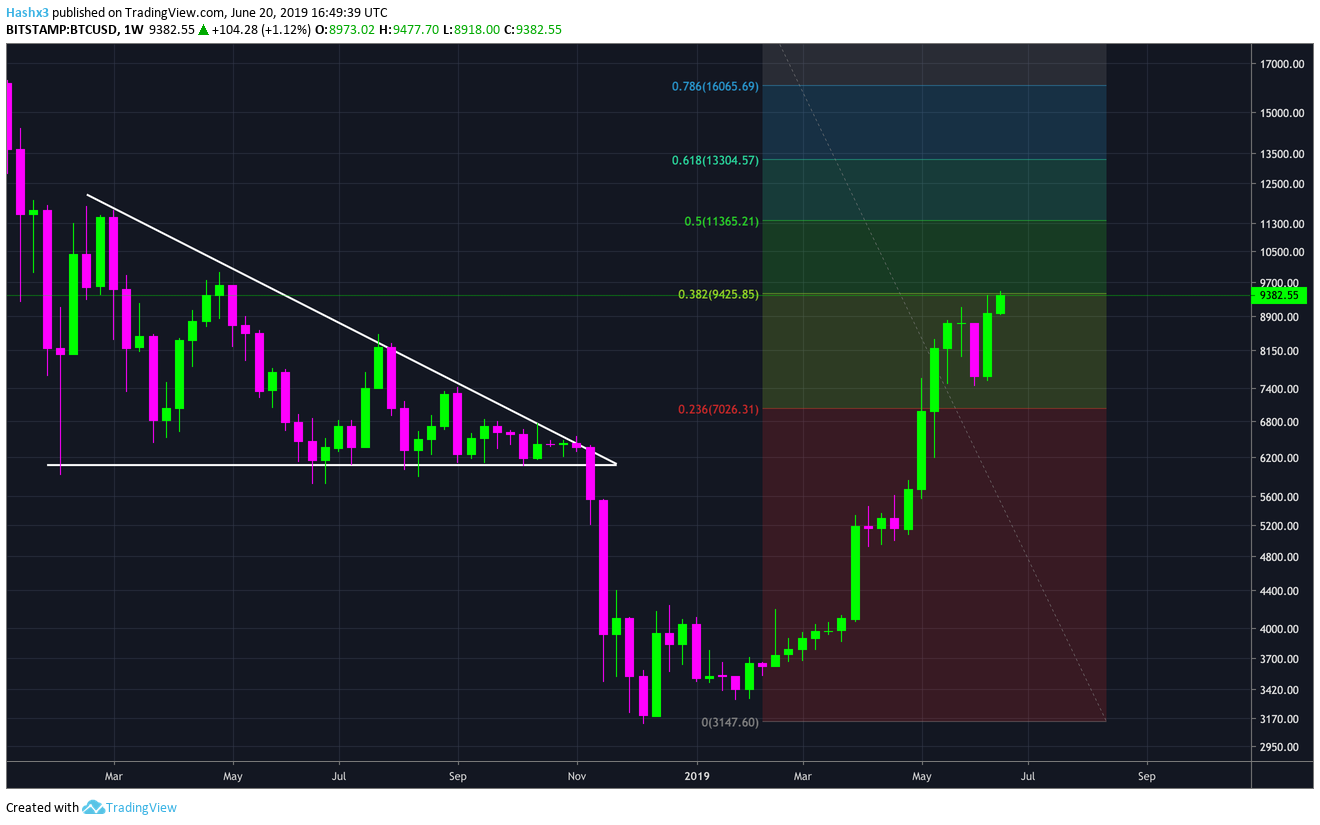
In previous articles, we have discussed the significance of the 0.382 fibonacci resistance level. Ultimately, it is the last line of defense for the bears. While the 0.382 fibonacci level at $9.4k is a critical resistance level, it is not as strong as it once was. The more times price tests a resistance or support level, the weaker that level becomes. If Bitcoin breaks above resistance at $9.4k, the cryptocurrency industry may officially be in a bull market.
NVT Indicator 100% Historic Accuracy
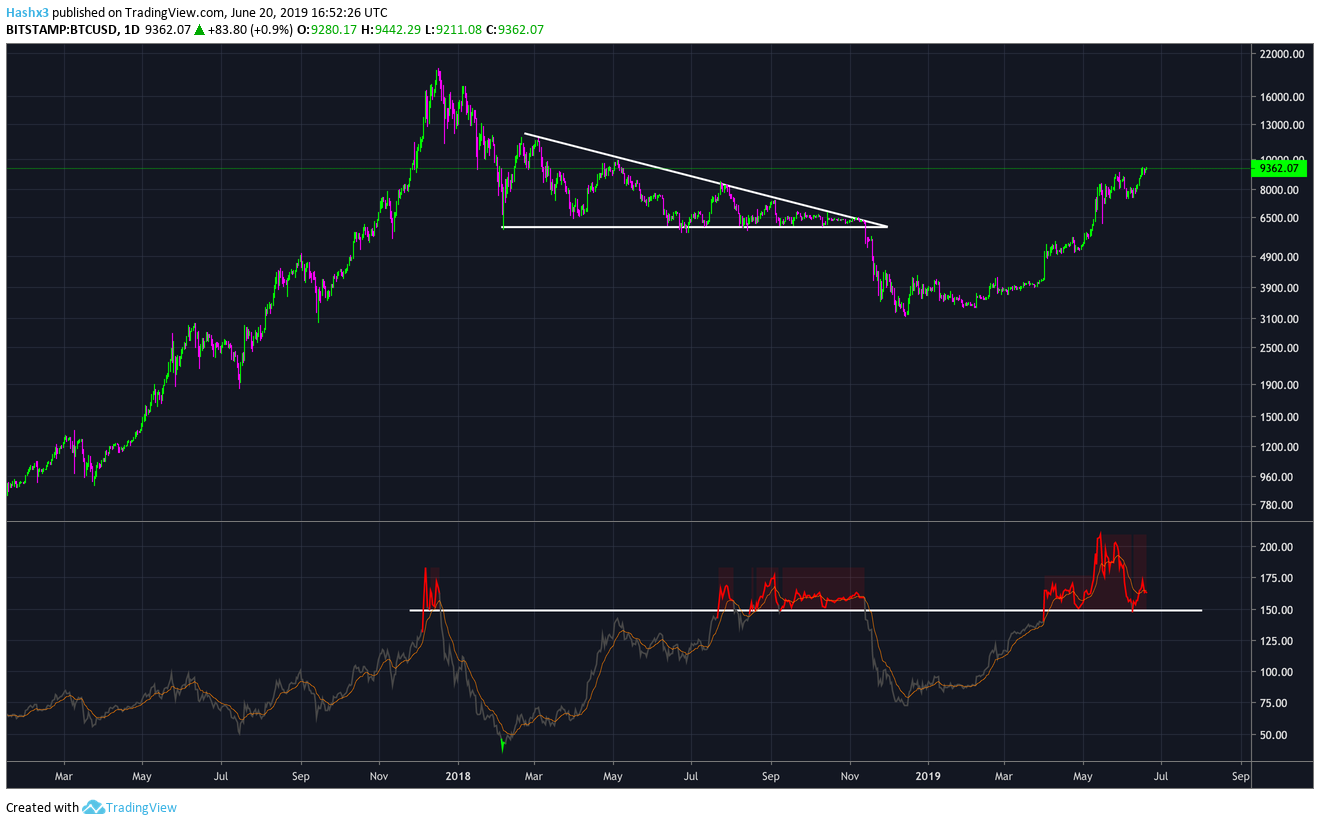
Above is a chart of Bitcoin’s NVT indicator. Each time Bitcoin enters a red or green level on the NVT indicator, it is a warning sign for traders that a significant trend reversal will occur. As you can see, Bitcoin has been in red zone territory since April of 2019 and a substantial price decrease is expected. The NVT Indicator is 12/12 since 2011 at calling overbought and oversold conditions. The most critical area of support has been at the 150 level. If the NVT should fall below this level, look for a 30-40% correction. That being said, the NVT indicator can remain overextended for a long period of time. For example, the NVT indicator remained overextended from July to November 2018, up until Bitcoin broke below $6k.
While past performance isn’t always indicative of future performance, the historic accuracy of the NVT indicator should be considered. Confirmation bias occurs when investors use historic metrics to predict future outcomes. Nevertheless, when a majority of traders are looking at common indicators such as the Fibonacci resistance level or the NVT indicator, it creates a self-fulfilling prophecy and the market moves in one direction.
BitMEX Funding and Premium Index and Daily RSI
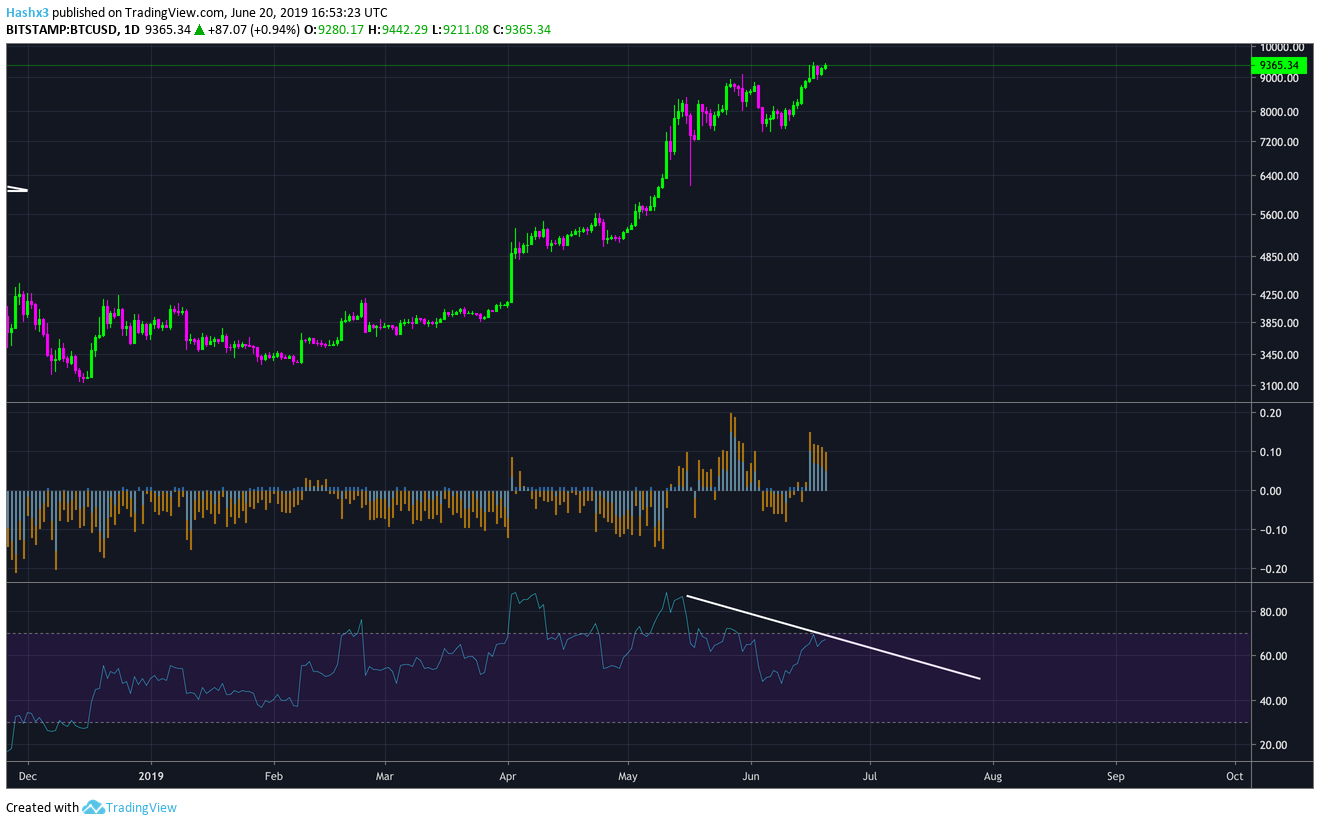
Above is a daily chart of Bitcoin with the BitMEX Funding and Premium index as well as the daily relative strength index. The funding and premium index has been a very accurate counter indicator for the collective market. Currently, the funding and premium index has been overextended for 5 days now. Many oscillators such as the funding and premium index and NVT indicator can remain in overbought or oversold conditions for extended periods of time. Therefore, they should be considered with this principle in mind. Additionally, Bitcoin’s daily RSI just formed its first lower-high after price reached a new yearly high of $9.4k. Furthermore, RSI is currently experiencing a bearish divergence which should serve as a warning signal to any long traders in the market.
Conclusion
Price looks to be overextended as the 0.382 fibonacci resistance level continues to hold. If Bitcoin breaks above the fibonacci resistance level at $9.4k, look for a retest of $10k and even a possibility of reaching $12k. If the daily RSI cannot make a new higher-high, expect a correction to the nearest support level at $8.8k. Look for a 30-40% correction if the NVT indicator falls below the 150 support level.
Disclaimer: The author of the article owns Bitcoin.