
Cryptocurrency
Trading Bitcoin: Green Engulfing Candle, Now What?
The one hour chart above showcases the insane bullish candle Bitcoin recently experienced. Daily Bitcoin is on a red 4 candle on the daily chart above. More importantly, Bitcoin was rejected at the previous top of $7.7k. Until Bitcoin can break above this level and form support, it looks as if this recent price increase […]
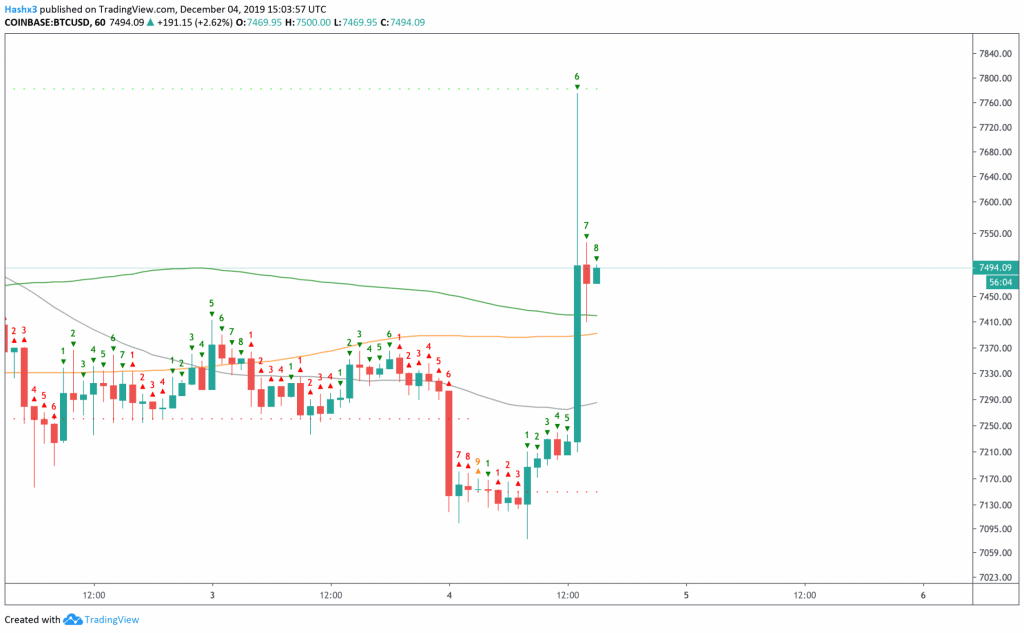
The one hour chart above showcases the insane bullish candle Bitcoin recently experienced.
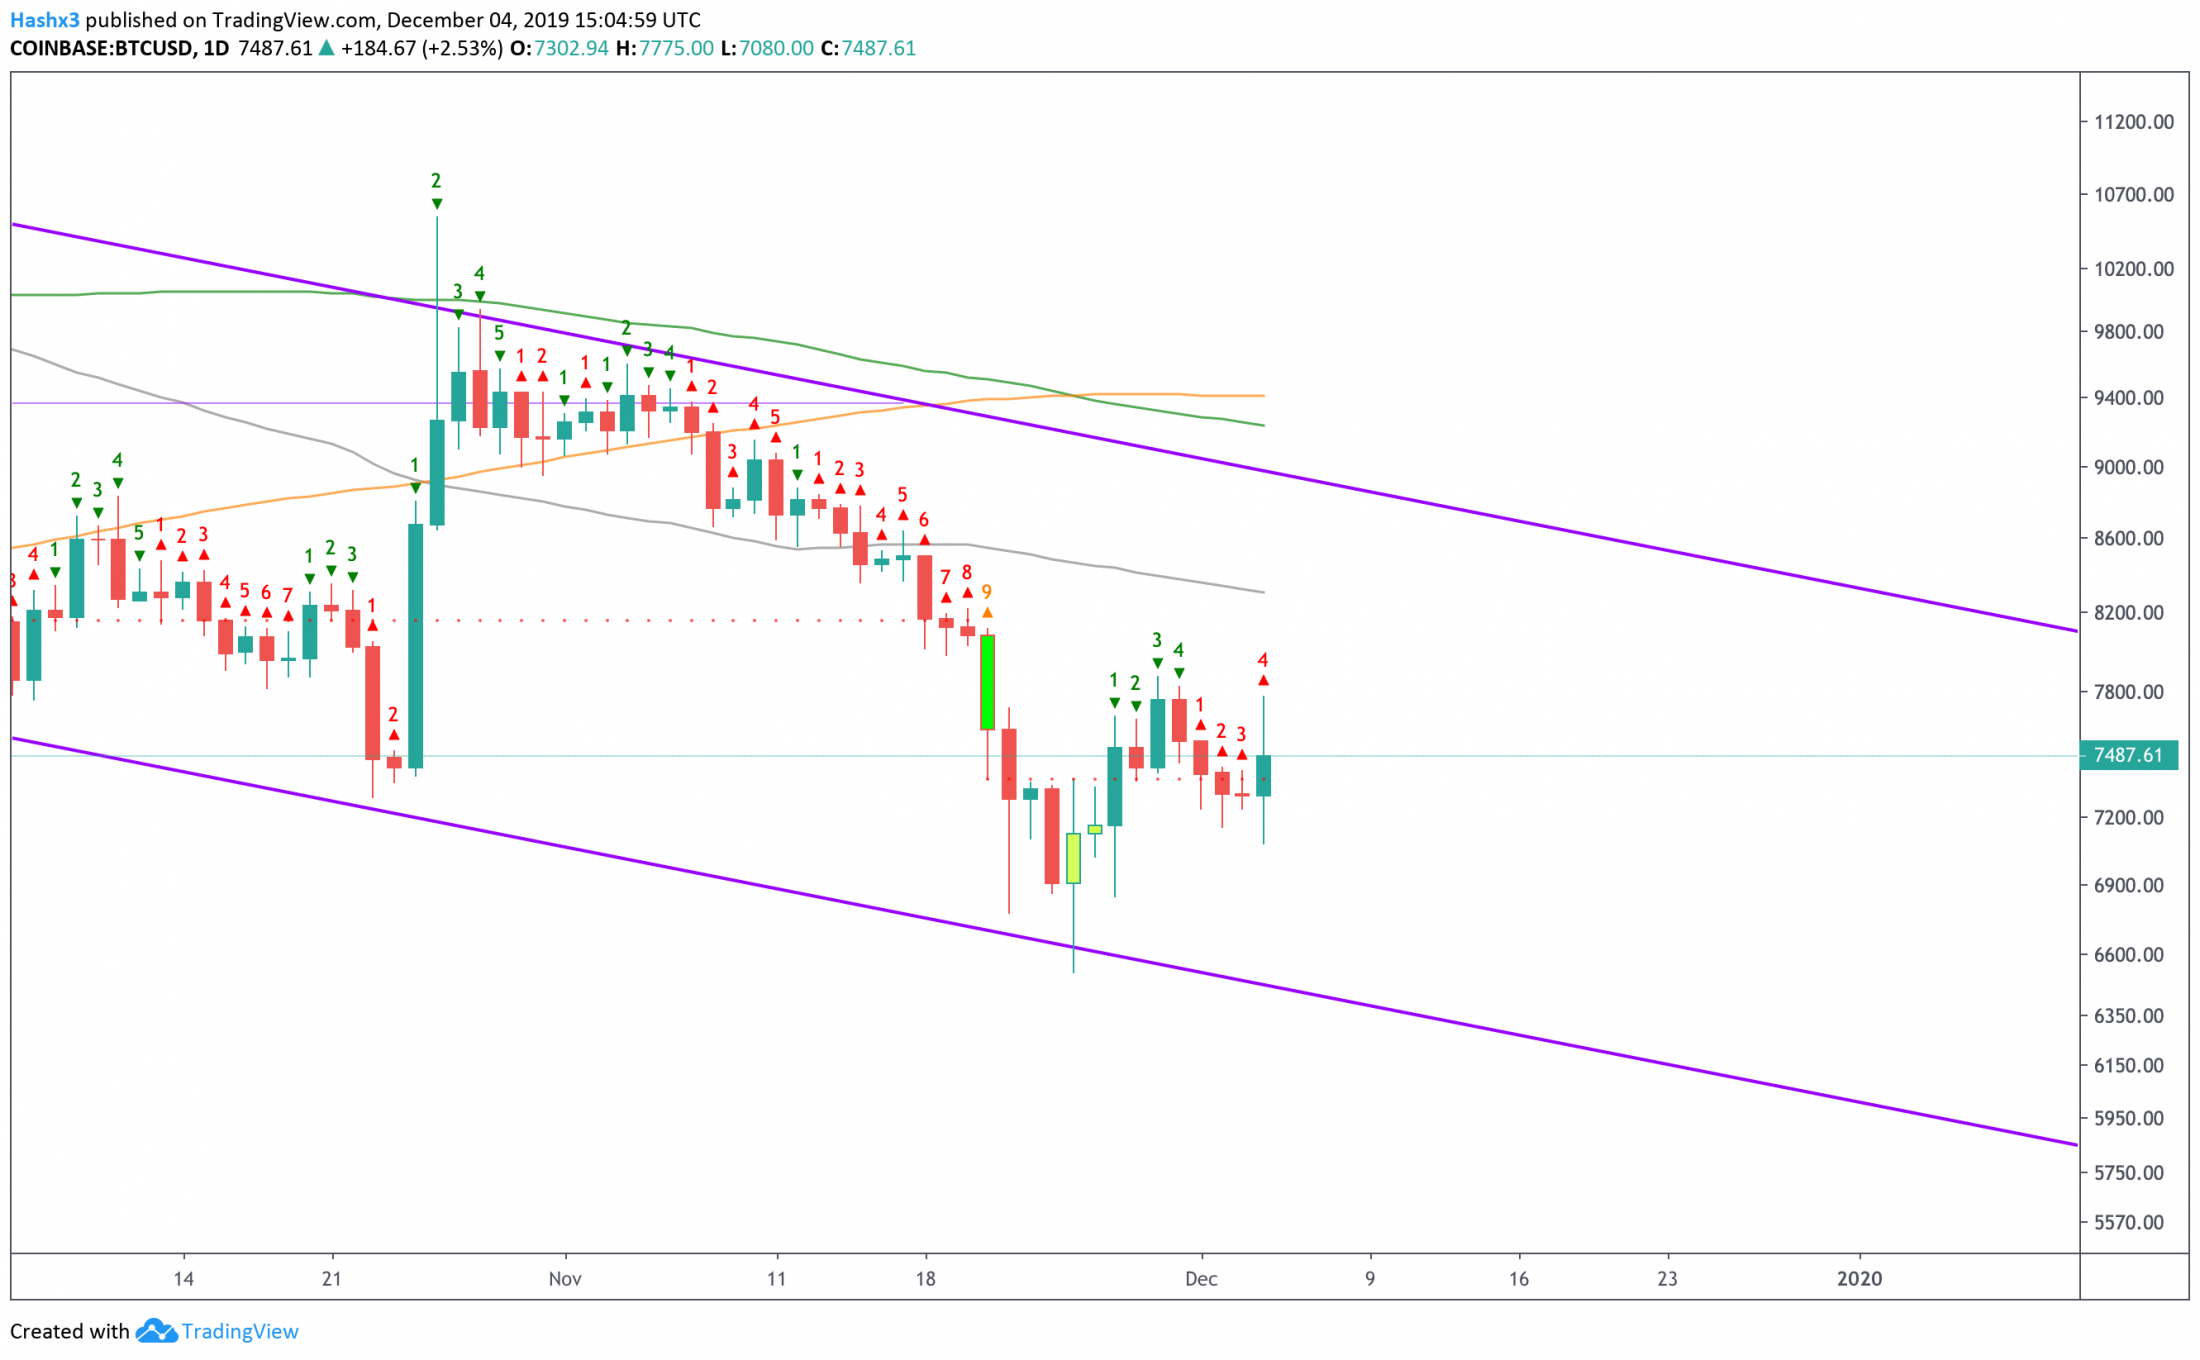
Daily
Bitcoin is on a red 4 candle on the daily chart above. More importantly, Bitcoin was rejected at the previous top of $7.7k. Until Bitcoin can break above this level and form support, it looks as if this recent price increase was nothing more than a failed rally.
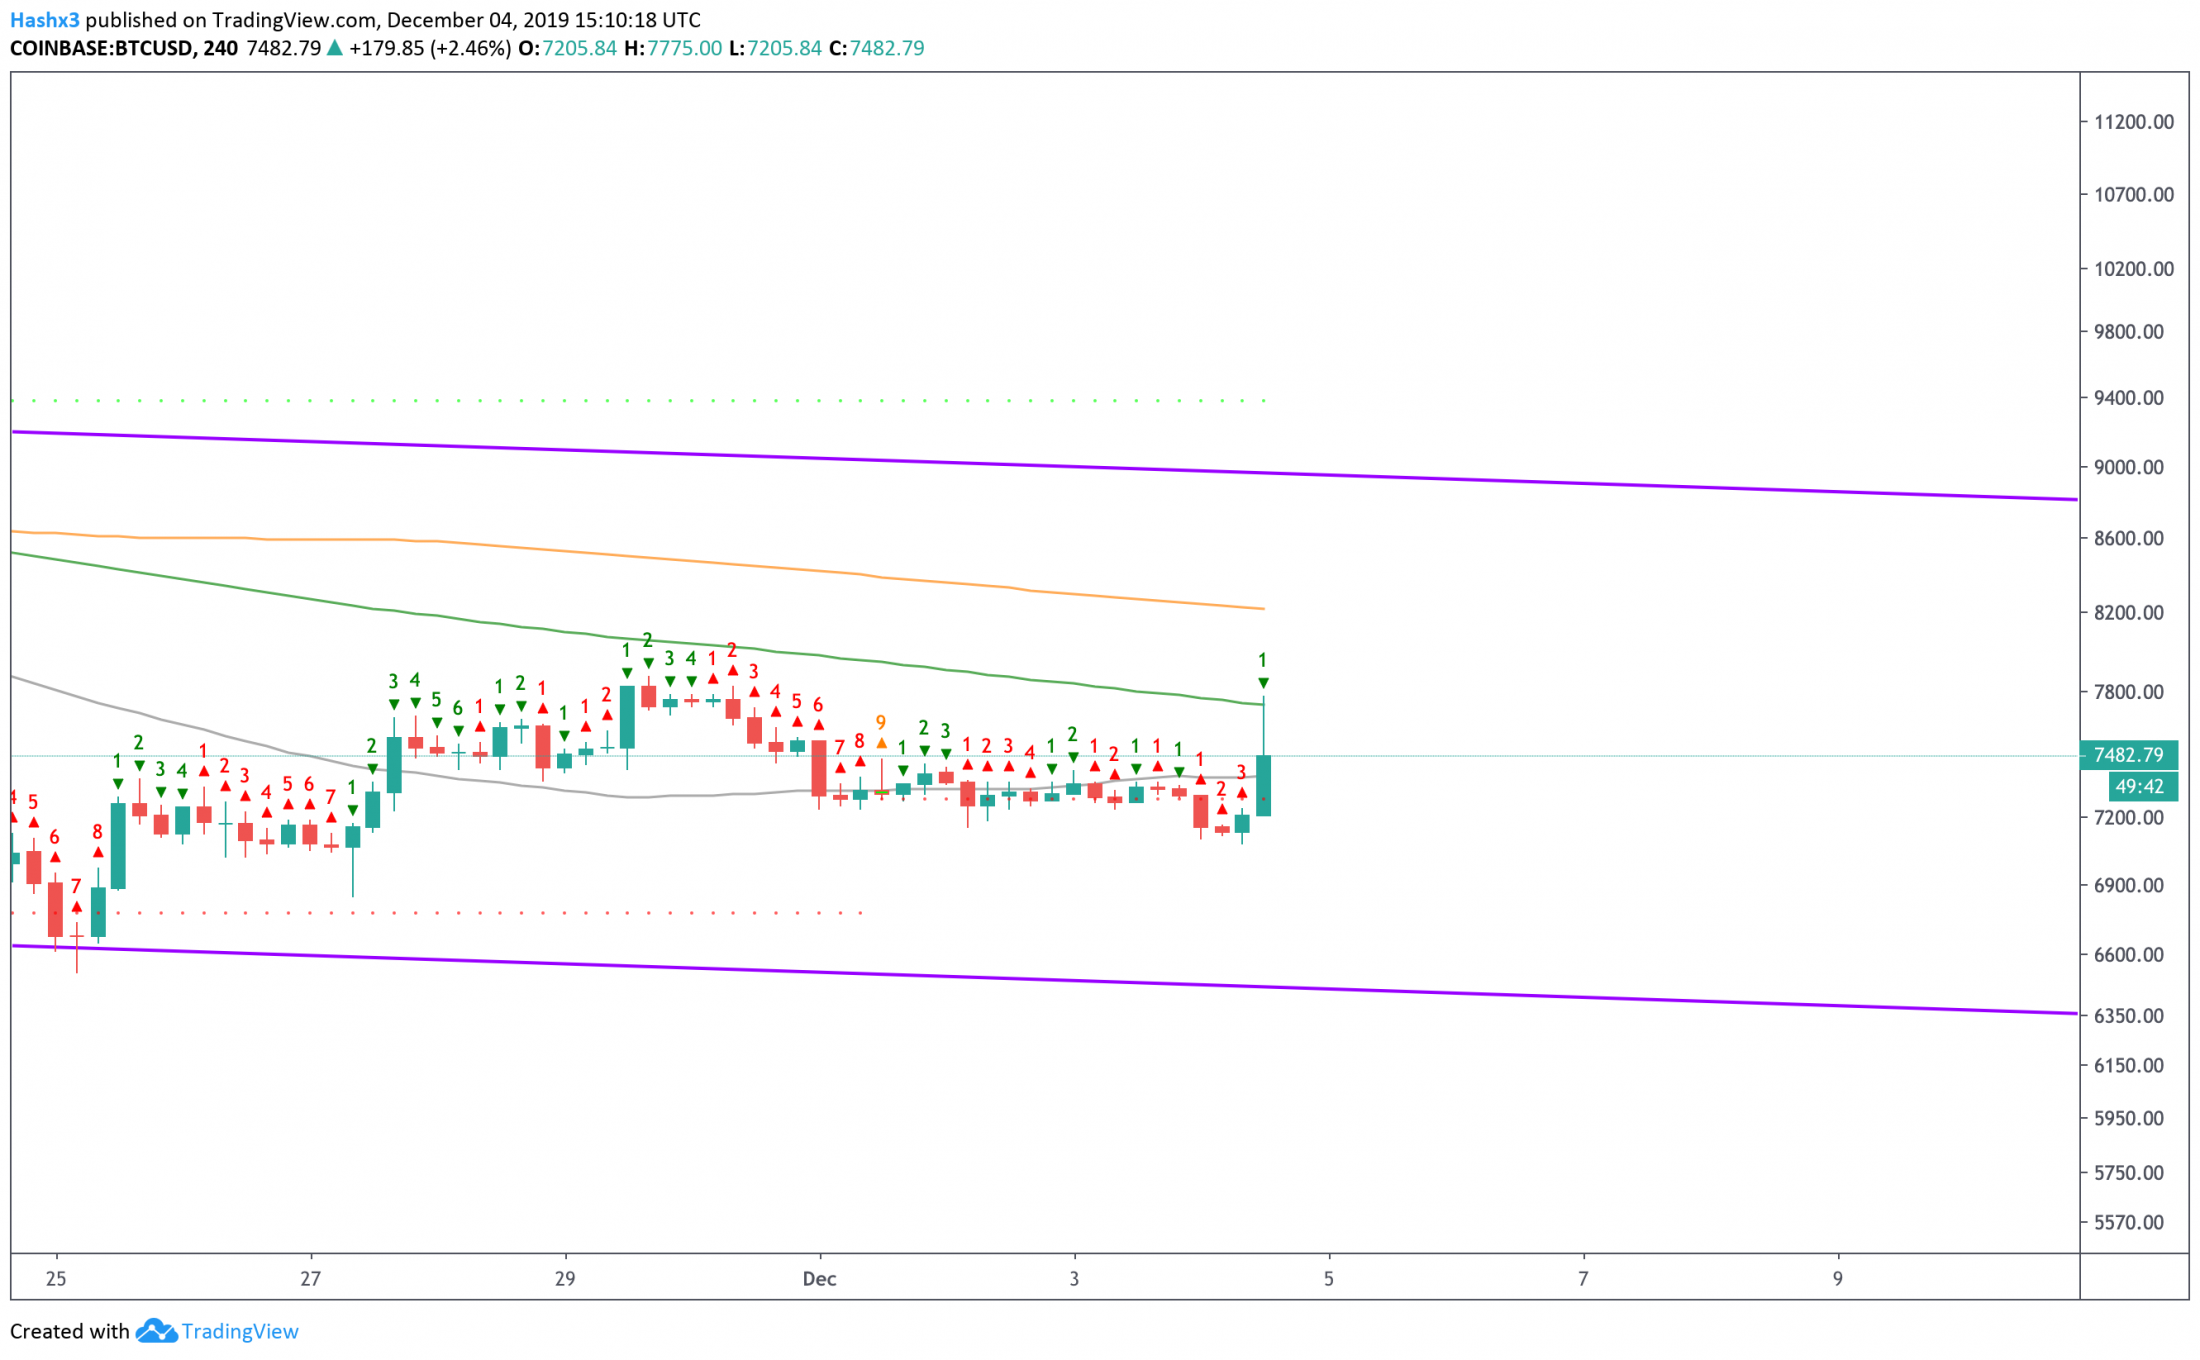
4 Hour
On the 4 hour chart above, you can see how Bitcoin was perfectly rejected by the 128MA (green). The 128MA has been a critical resistance and support level throughout Bitcoin’s history. The fact that we were not able to rise above it is a testament to how bearish the trend actually is.
Conclusion
Until the bulls can break us out of the downward parallel channel price will keep falling leading up to the halving. Current resistance remains at $7.7k while critical support stands at $7.1k.
Disclaimer: The author of the article hodls Bitcoin.