
Cryptocurrency
Trading Bitcoin: Hovering at $11.3k
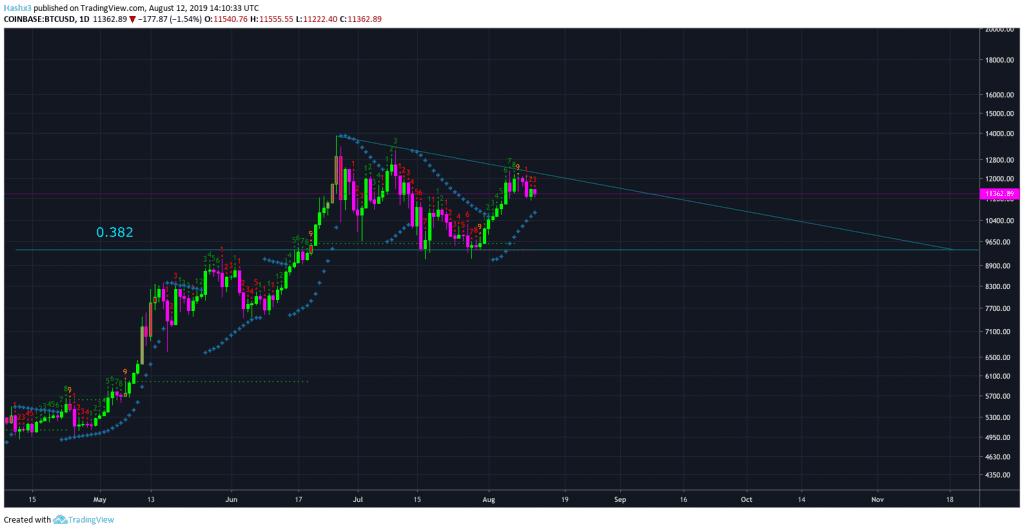
Hovering at $11.3k Bitcoin has been hovering at $11.3k ever since price was rejected at $12k. Currently, the TD sequential indicator is on a red 3 of 9 candle. Yesterday, sequential formed a red 2, however the red 2 candle did not close below the previous red 1 candle. Therefore, a short trade was not […]
Hovering at $11.3k
Bitcoin has been hovering at $11.3k ever since price was rejected at $12k. Currently, the TD sequential indicator is on a red 3 of 9 candle. Yesterday, sequential formed a red 2, however the red 2 candle did not close below the previous red 1 candle. Therefore, a short trade was not activated. Additionally, the Lucid SAR (blue x’s) are providing bullish support at $10.6k. However, after reaching a green 9, a bullish trend will typically enter a 1-4 red candle correction before resuming bullish price action. Furthermore, tomorrow we may reach a red 4 candle on the daily. At this hypothetical point, it will be wise to reevaluate the trend.
4 Hour
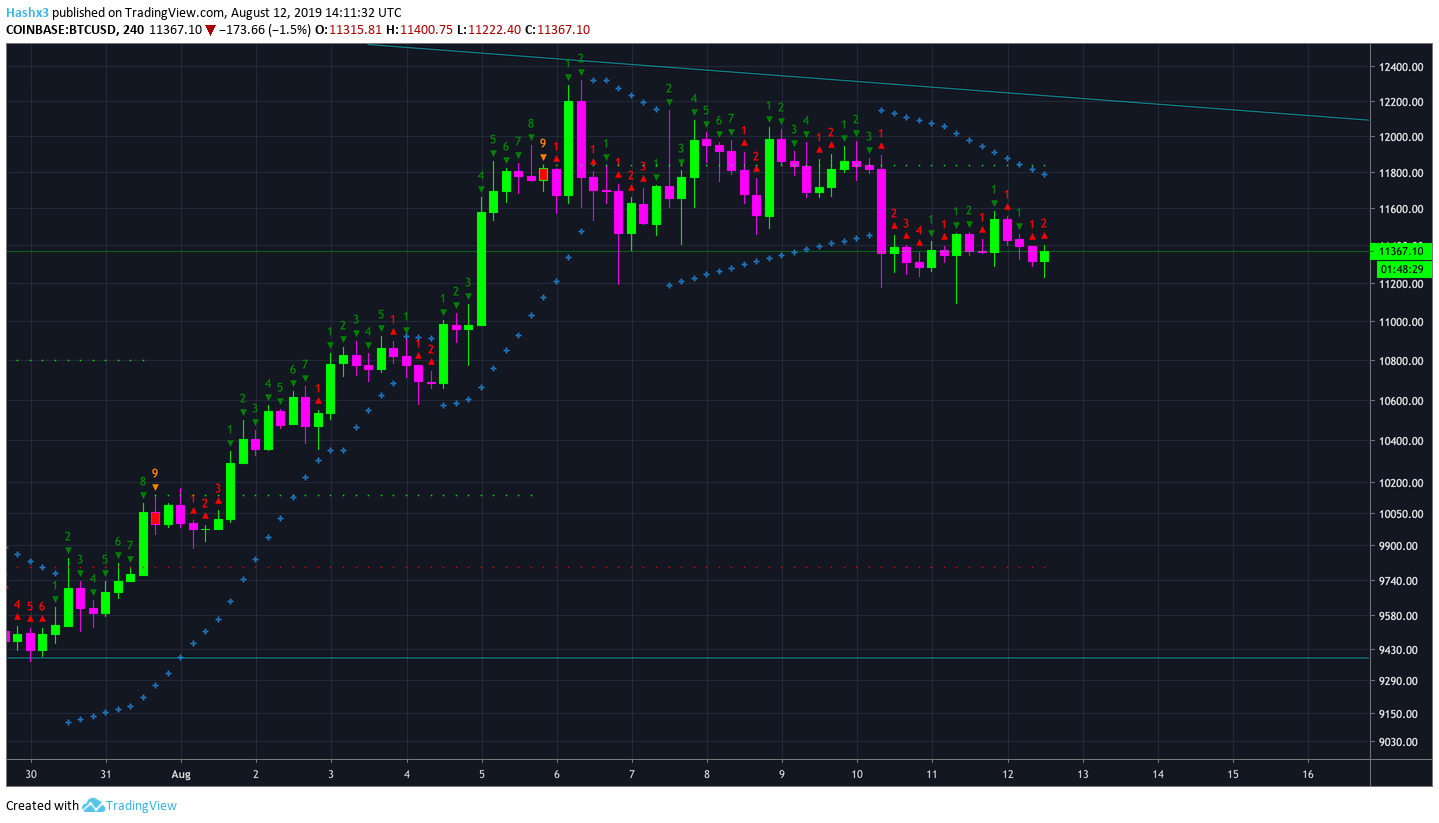
Currently, Bitcoin’s 4 hour chart is in a bearish posture after being rejected at $12k. Sequential is on a red 2 which has not closed below the previous red 1 candle. If our current red 2 candle closes below the previous red 1 candle that is an indication to place a short trade on the 4 hour timeframe. As of now, Bitcoin’s 4 hour chart remains neutral.
Weekly
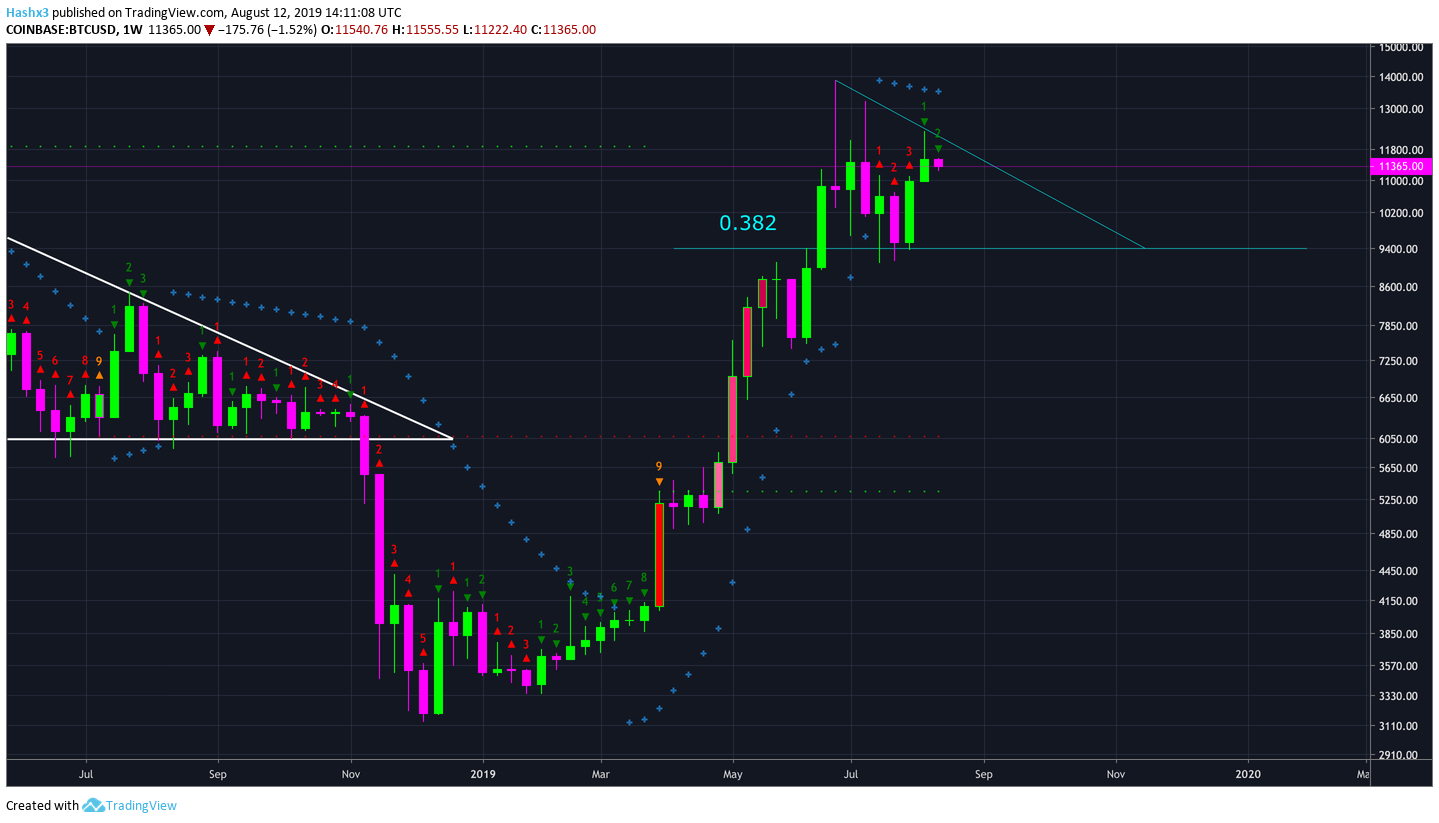
Bitcoin is on a green 2 of 9 candle on the weekly chart. However, our current green 2 candle has not closed above the previous green 1 candle. According to sequential theory, a green 2 closing above a green 1 is an indication to place a long trade. However, this may not apply to our current circumstances because Bitcoin would have to close above resistance at 12k in order to signal a long trade. At this time, you would have already missed the move and the momentum of the trend may have changed. For now, the weekly chart remains neutral.
Conclusion
Bitcoin is hovering at $11.3k after being rejected at $12k resistance. Price must not fall into a descending triangle formation similar to what we experienced before our break below $6k. If the bulls can break above the previous local high at $12.3k, significant buying momentum will likely enter the market. Above all, the trend is in a bearish posture and remains in a no trade zone.