
Cryptocurrency
Trading Bitcoin: Is the Bottom In?
Is the Bottom In? Bitcoin continues its bearish consolidation as price trades at $8.7k. On the daily chart above, the sequential indicator has experienced a price flip to a red 1. Therefore, sequential is neutral for now. Price continues to consolidate in a downward price channel between the 128MA (green) and the 50MA (grey). As […]

Is the Bottom In?
Bitcoin continues its bearish consolidation as price trades at $8.7k. On the daily chart above, the sequential indicator has experienced a price flip to a red 1. Therefore, sequential is neutral for now. Price continues to consolidate in a downward price channel between the 128MA (green) and the 50MA (grey). As of now, the daily chart is neutral however the bulls must remain above the 50MA (grey) or else a further decline to the $8.2k price level is probable.
4 Hour
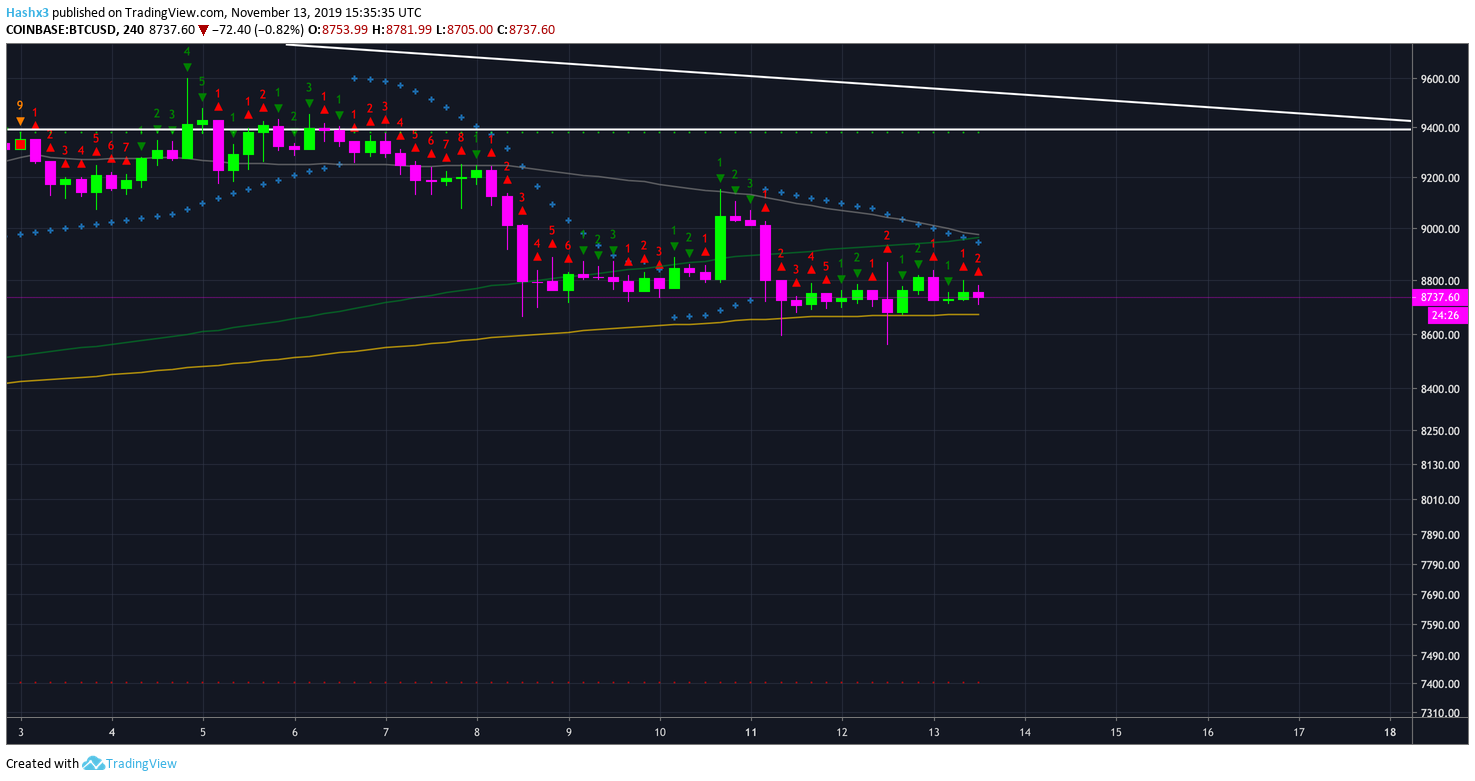
The 4 hour chart is in a bearish posture when compared to the daily chart. The sequential indicator has created a red 2. In sequential theory, a red 2 closing below the previous red 1 is an indication to place a short trade. Additionally, the Lucid SAR (blue x’s) is still acting as bearish resistance above price. Also, the 50MA (grey) is about to intersect the 128MA(green) which in classical technical analysis is known as a bearish crossover. However, the bulls are still holding the 200MA(orange). Overall, the 4 hour chart is bearish.
BTC/USD Bitfinex Shorts
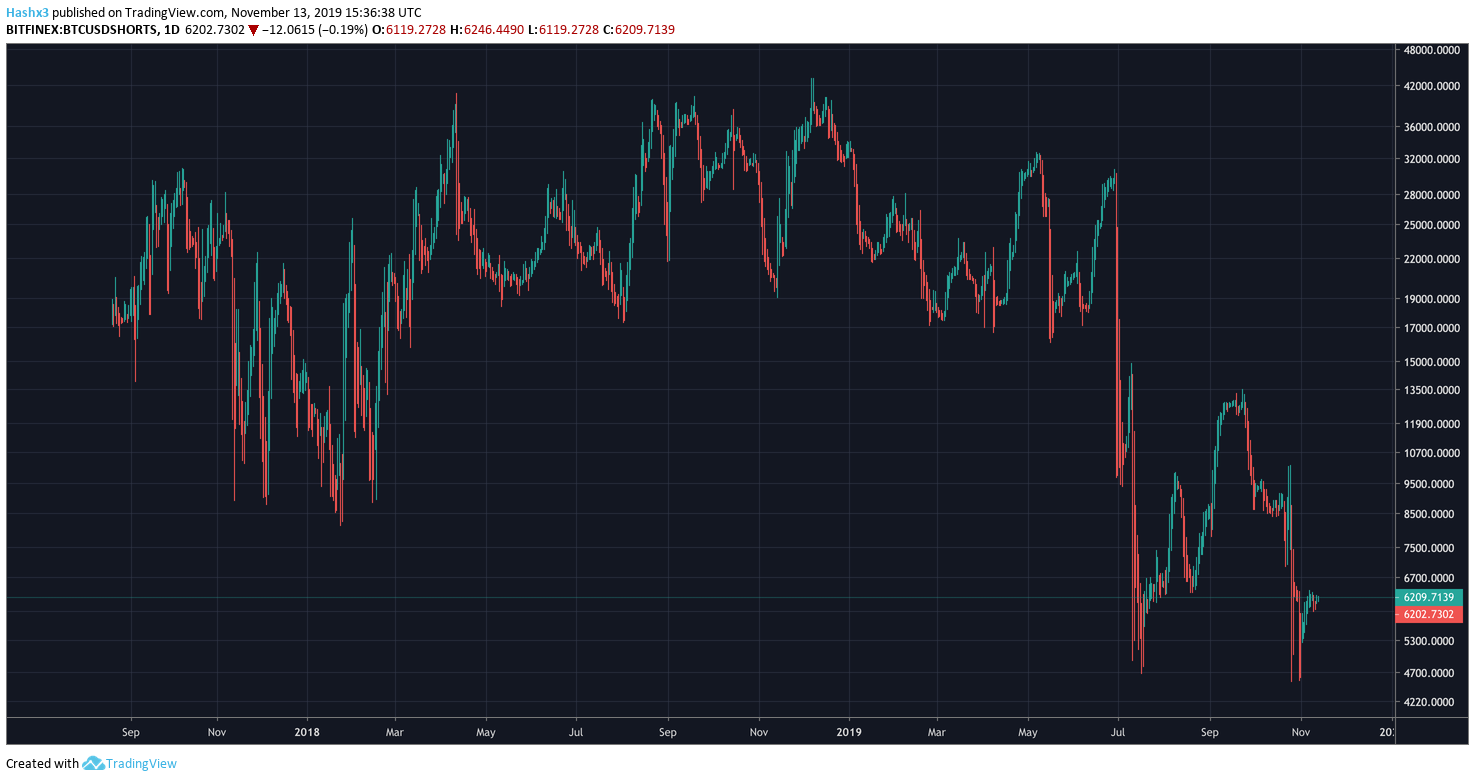
Shorts are still at an incredibly low level relative to the rest of 2019. A short squeeze is not going to power the bulls higher back into the $9.5k price region.
Google Trend Data
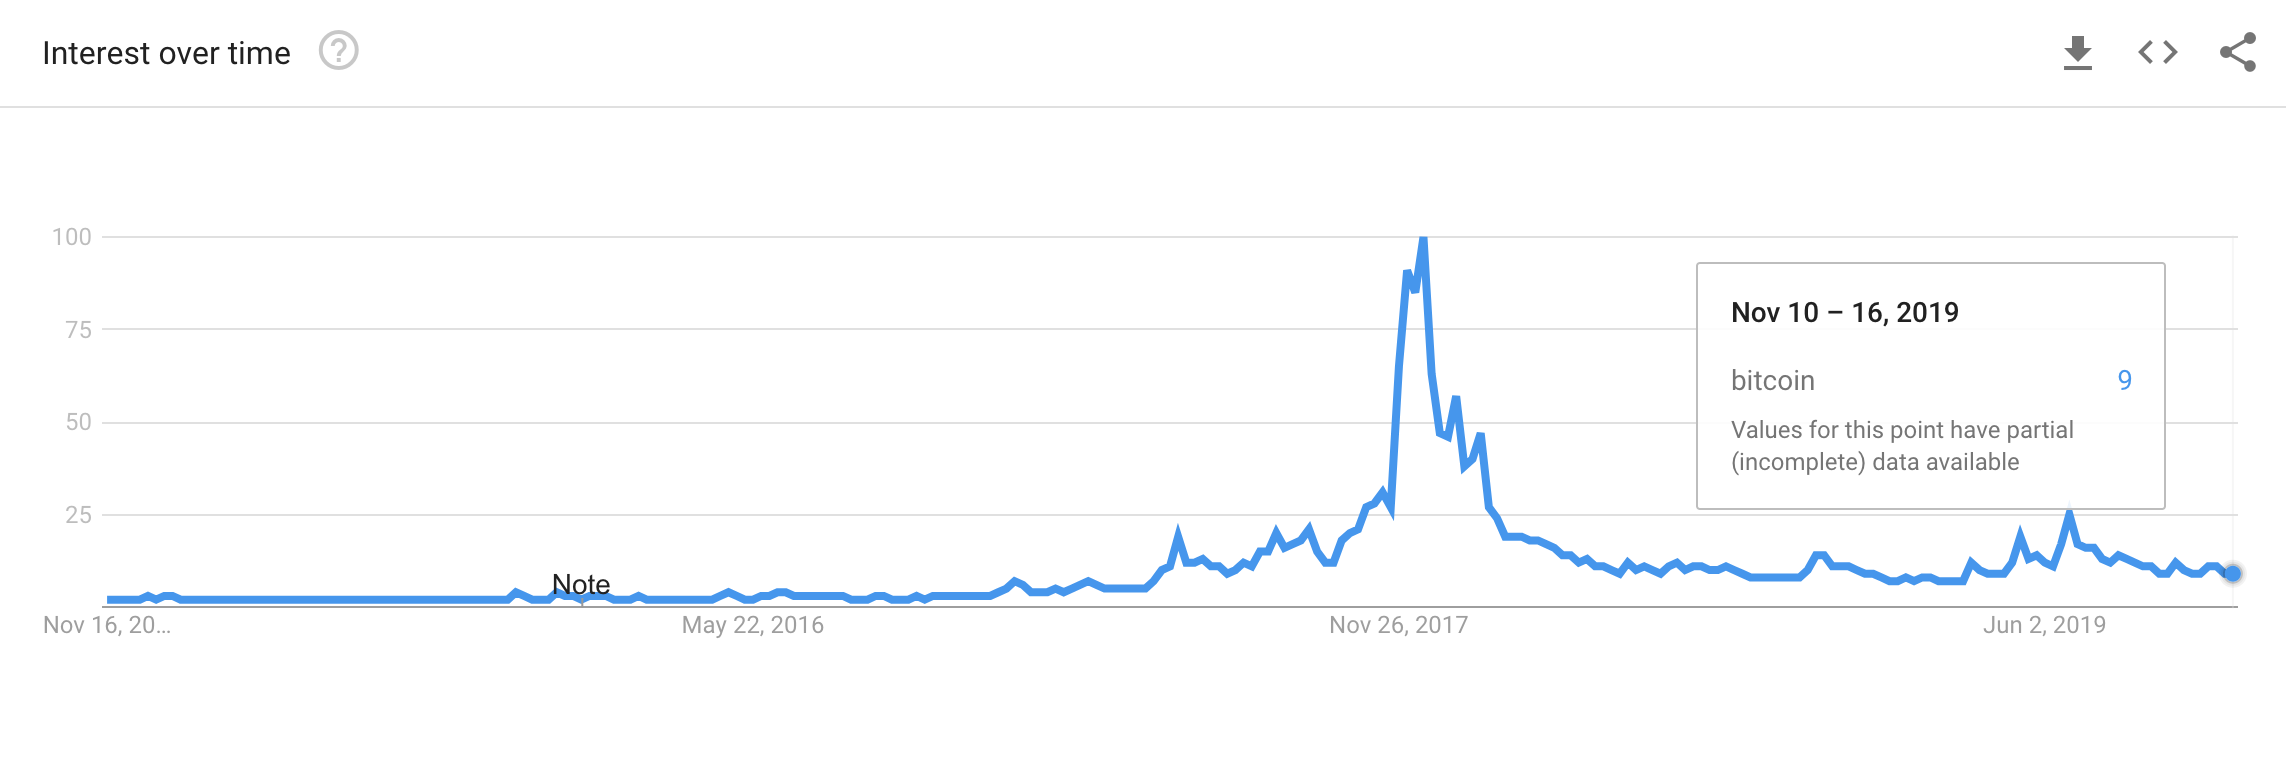
In two years of google trends data, Bitcoin has never dropped below a 7 as a search term. We are currently at a 9 and therefore may be coming close to a bottom in overall interest.
Conclusion
Bearish consolidation continues as we get closer to the halving. Bitcoin interest is at a profound low, this could be bearish or bullish for the trend, nevertheless it’s symbolic of a bottom in interest and curiosity. Overall, the trend remains bearish, the bulls must hold the 50MA (grey) on the daily chart or else a further decline to the $8.2k support level is likely.
Disclaimer: The author of the article hodls Bitcoin.