
Cryptocurrency
Trading Bitcoin: Is this Rally For Real?
Is this Rally For Real? This morning, Bitcoin experienced an unexpected price increase. Currently, price is trading at roughly $8.5k after being rejected at $8.7k. In yesterday’s article, we noticed the 4 hour time frame was slightly bullish and if a subsequent increase were to occur, it would likely be rejected at the 128MA (green). […]

Is this Rally For Real?
This morning, Bitcoin experienced an unexpected price increase. Currently, price is trading at roughly $8.5k after being rejected at $8.7k. In yesterday’s article, we noticed the 4 hour time frame was slightly bullish and if a subsequent increase were to occur, it would likely be rejected at the 128MA (green). As you can see from the chart above, Bitcoin’s rally was perfectly rejected at the 128MA and is now trading below this resistance level.
Daily
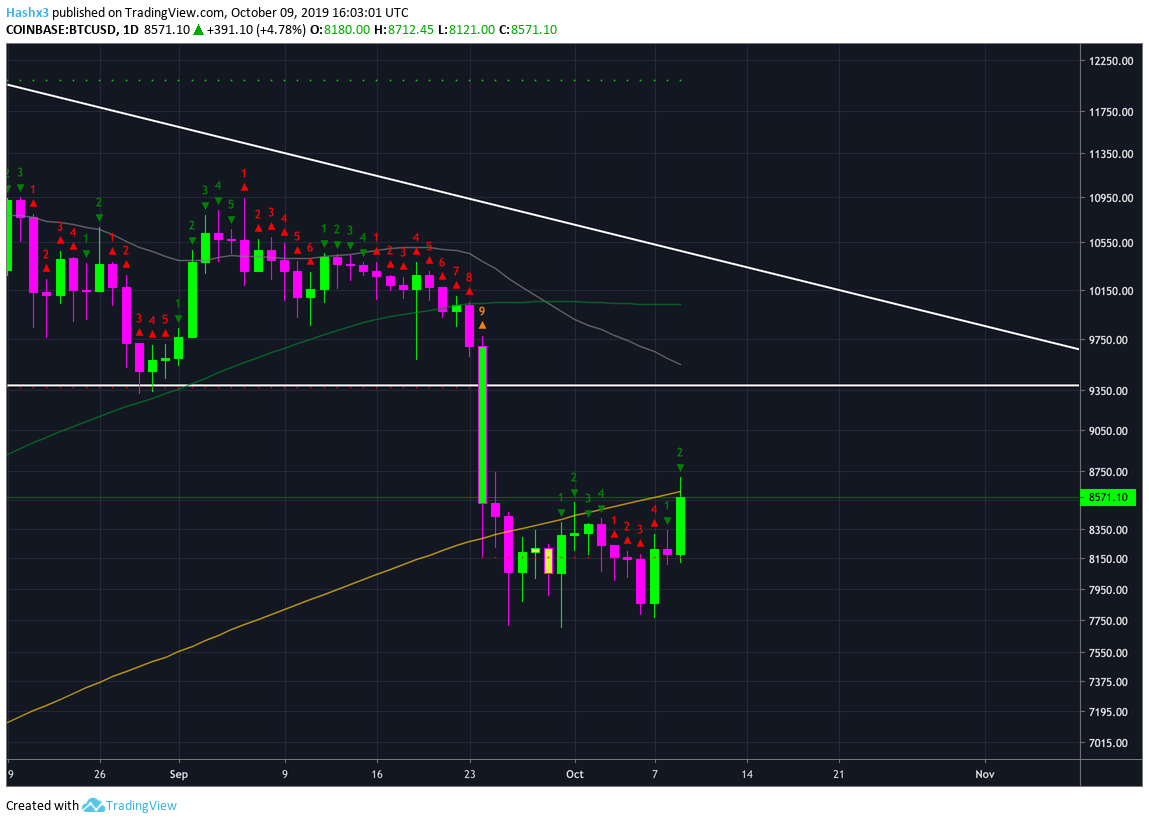
On the daily chart above, you can see that price was rejected at the 200MA (orange). While this morning’s upward spike is a promising sign for the bulls, price needs to close above the 200MA for a further bullish continuation.
Weekly
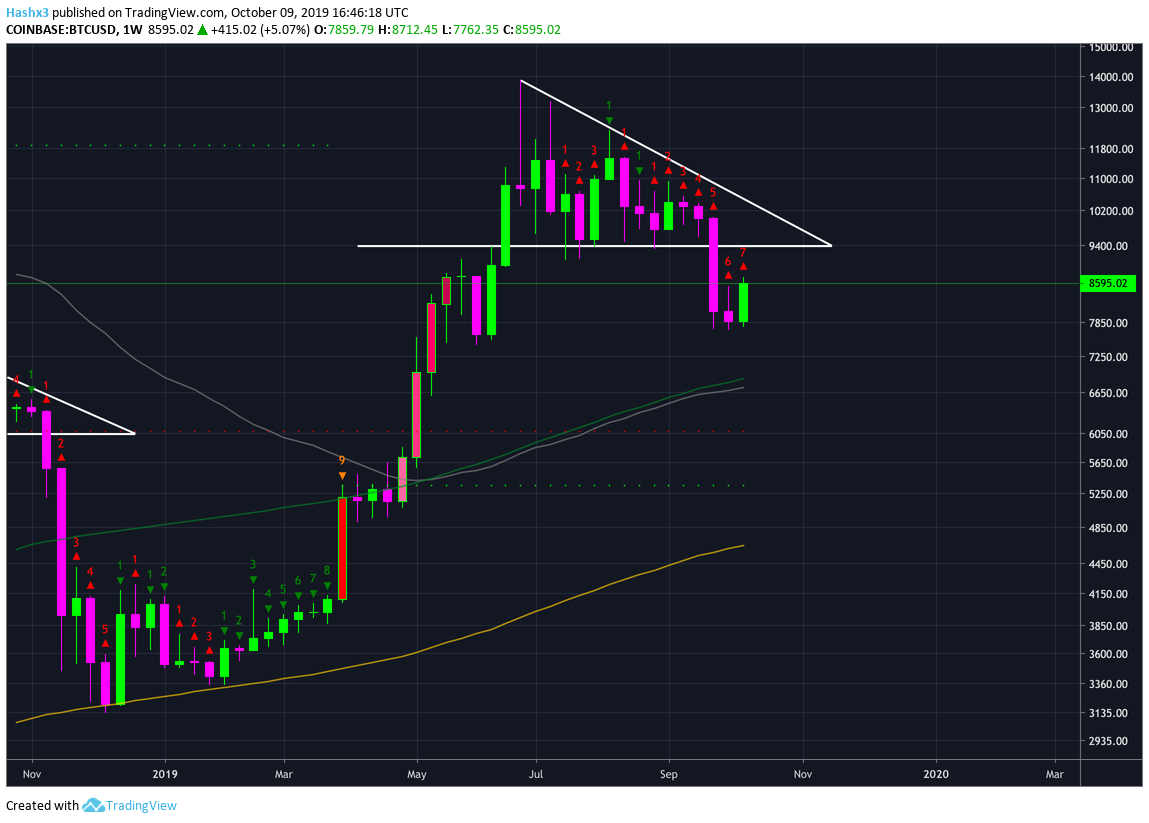
If the weekly chart closes below $8.5k, we will still be in a bearish environment. If price closes above $8.5k on the weekly, Bitcoin will likely look to test further upward resistance levels. It’s a very simple approach: anything between $8.5k and $8k is considered a no-trade zone. If we break out to the top of the no-trade zone we will be bullish on a weekly timeframe. However, if price breaks below $8k we will be bearish across all timeframes.
Conclusion
While Bitcoin rallies, we are looking for what will come next. Current support remains at $8k and resistance stands at $8.7k. Bitcoin has a no-trade zone between $8k and $8.5k, and price could break out in either direction. It is possible that Oct. 5 was the second bottom and end of the downtrend. Still, much has to develop before price makes a definite move.