
Cryptocurrency
Trading Bitcoin: Last Chance To Buy Bitcoin Sub $10k?
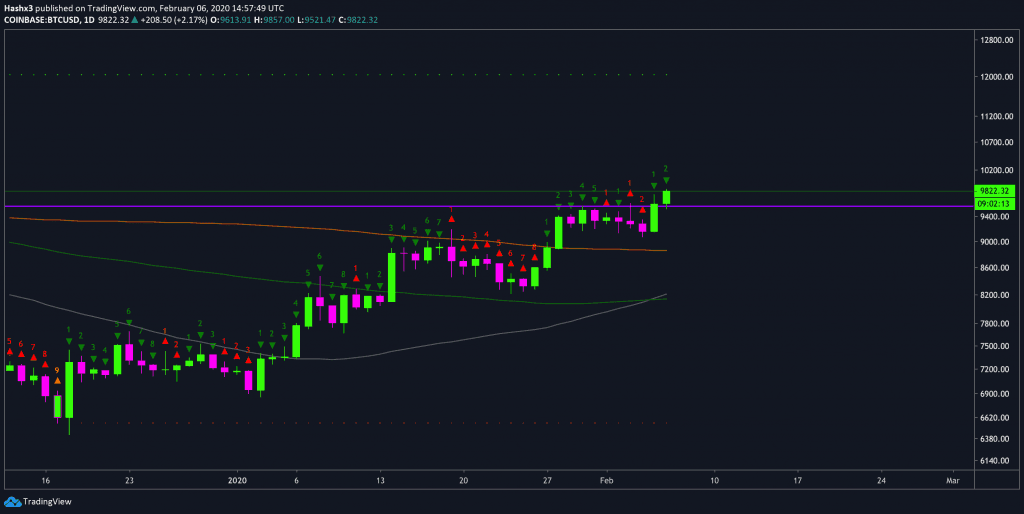
Daily On the daily chart above, Bitcoin has reached a green 2 on the sequential indicator. In sequential theory, a green 2 closing above the previous green 1 is an indication to place a long trade. Furthermore, the bulls have now broken above the critical resistance level at $9.5k. Currently the trend is consolidating and […]
Daily
On the daily chart above, Bitcoin has reached a green 2 on the sequential indicator. In sequential theory, a green 2 closing above the previous green 1 is an indication to place a long trade. Furthermore, the bulls have now broken above the critical resistance level at $9.5k. Currently the trend is consolidating and forming support at roughly $9.6k.
4 Hour
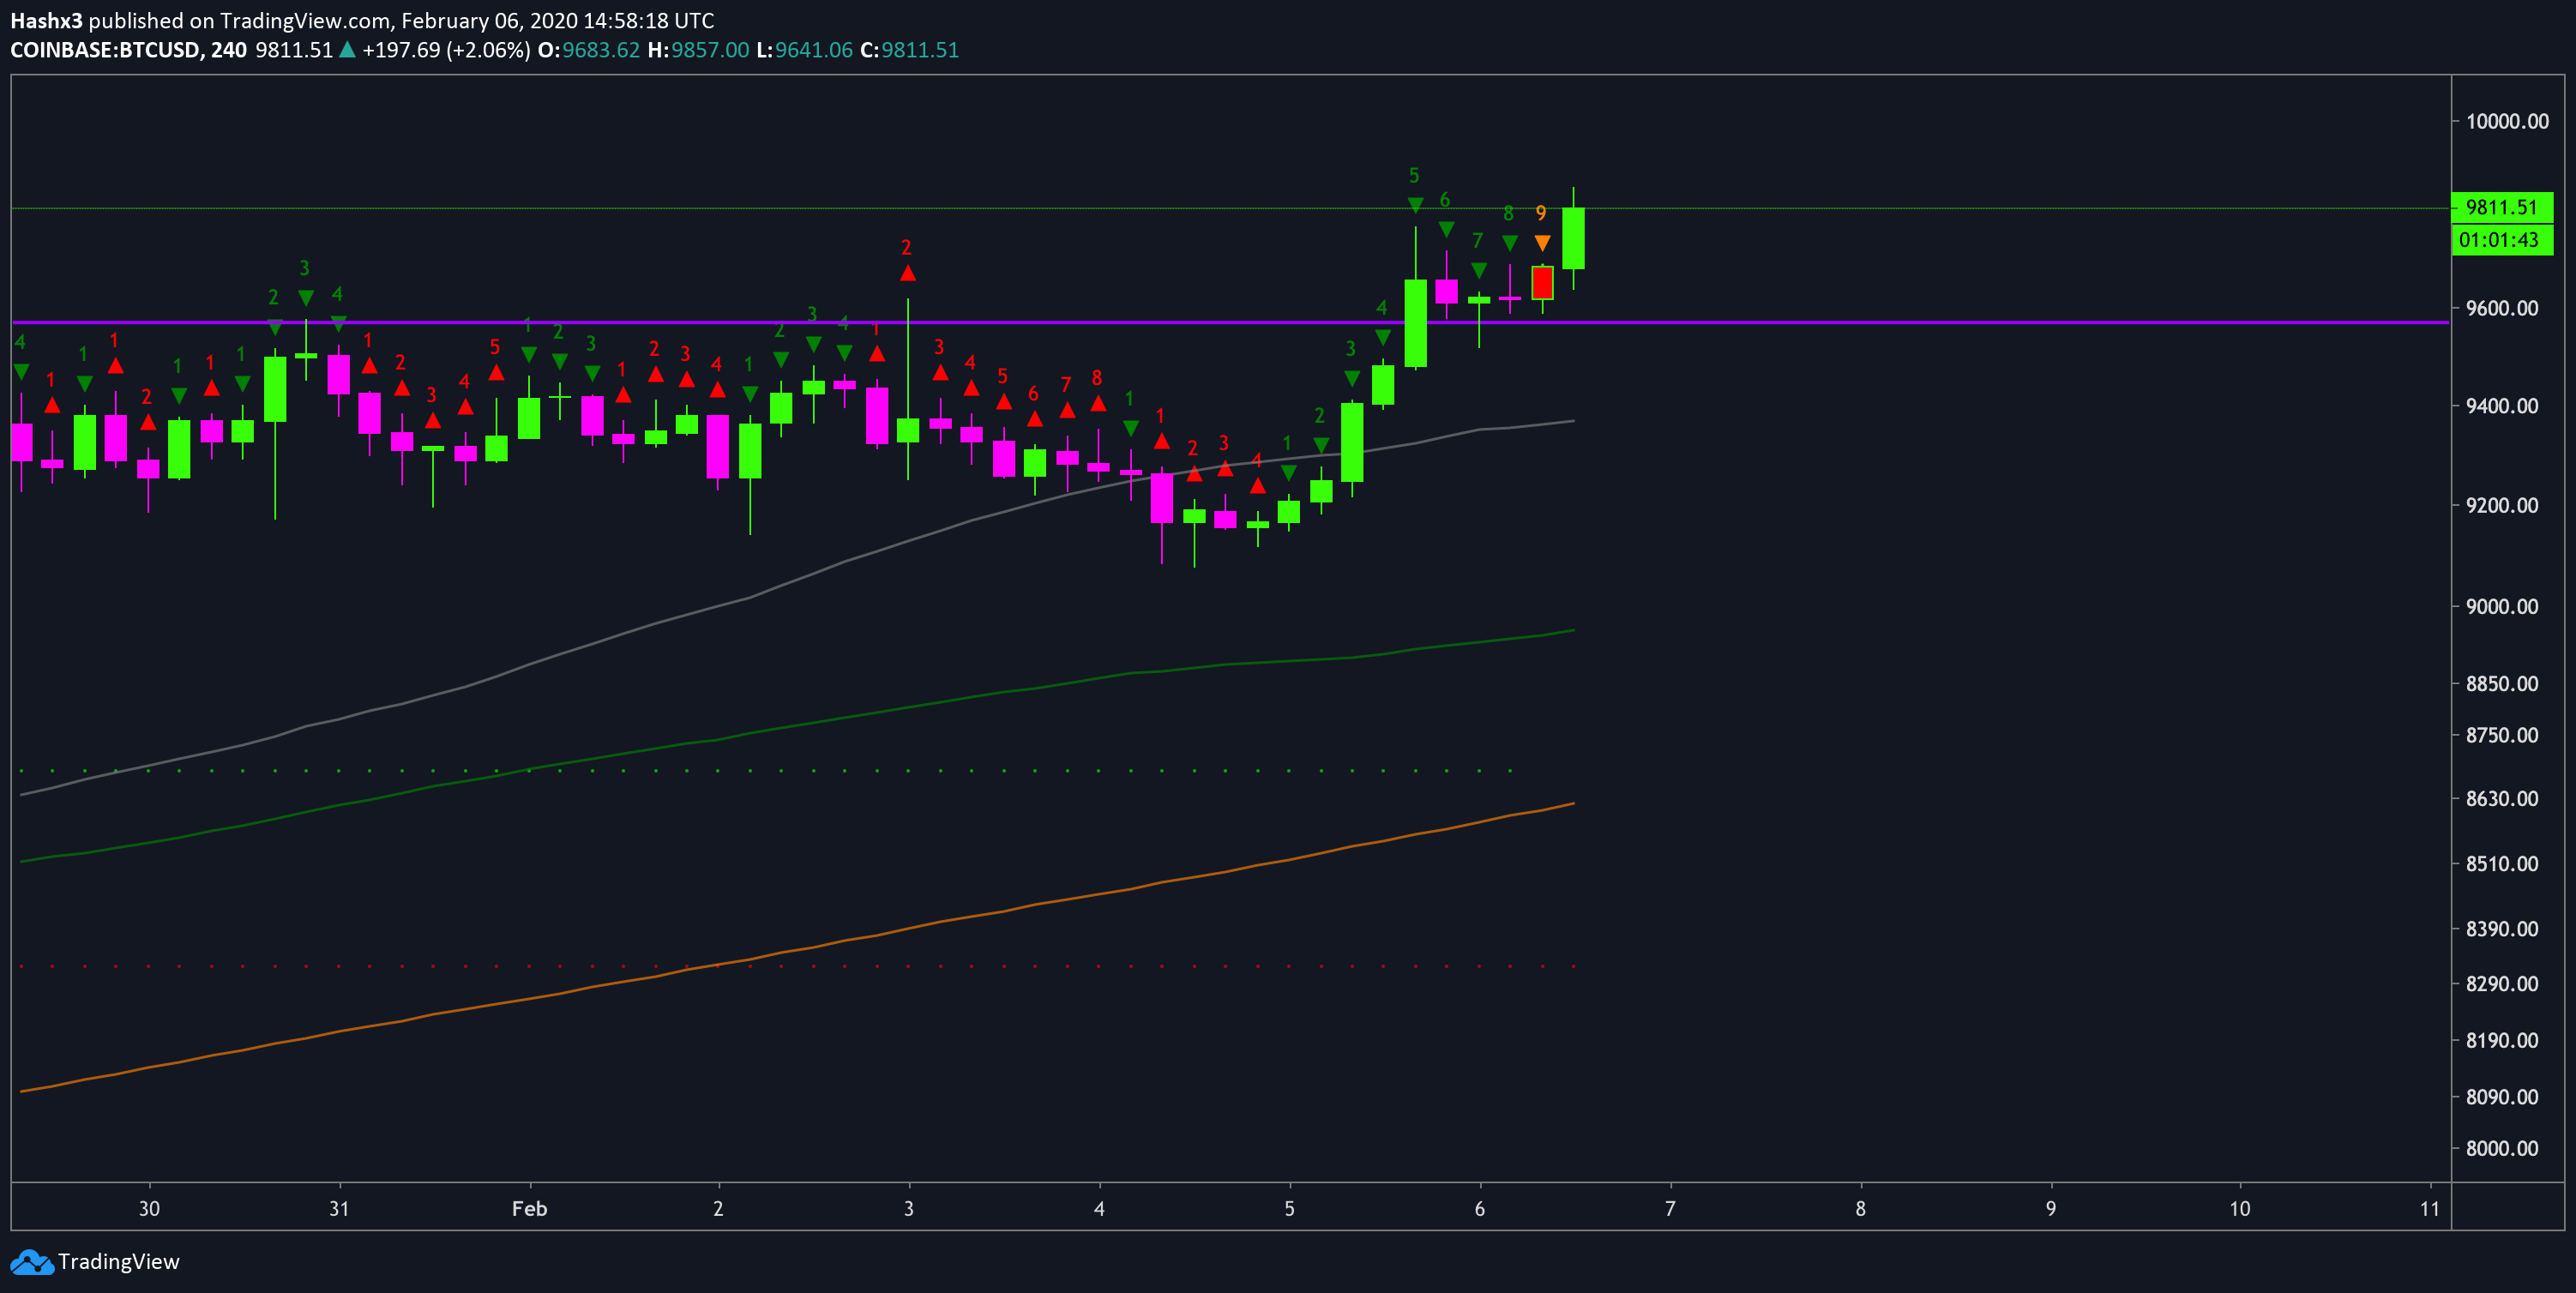
As you can see on the 4 hour chart above, Bitcoin popped on a green 9 sequential and is starting a new countdown phase.
BTC/USD Shorts
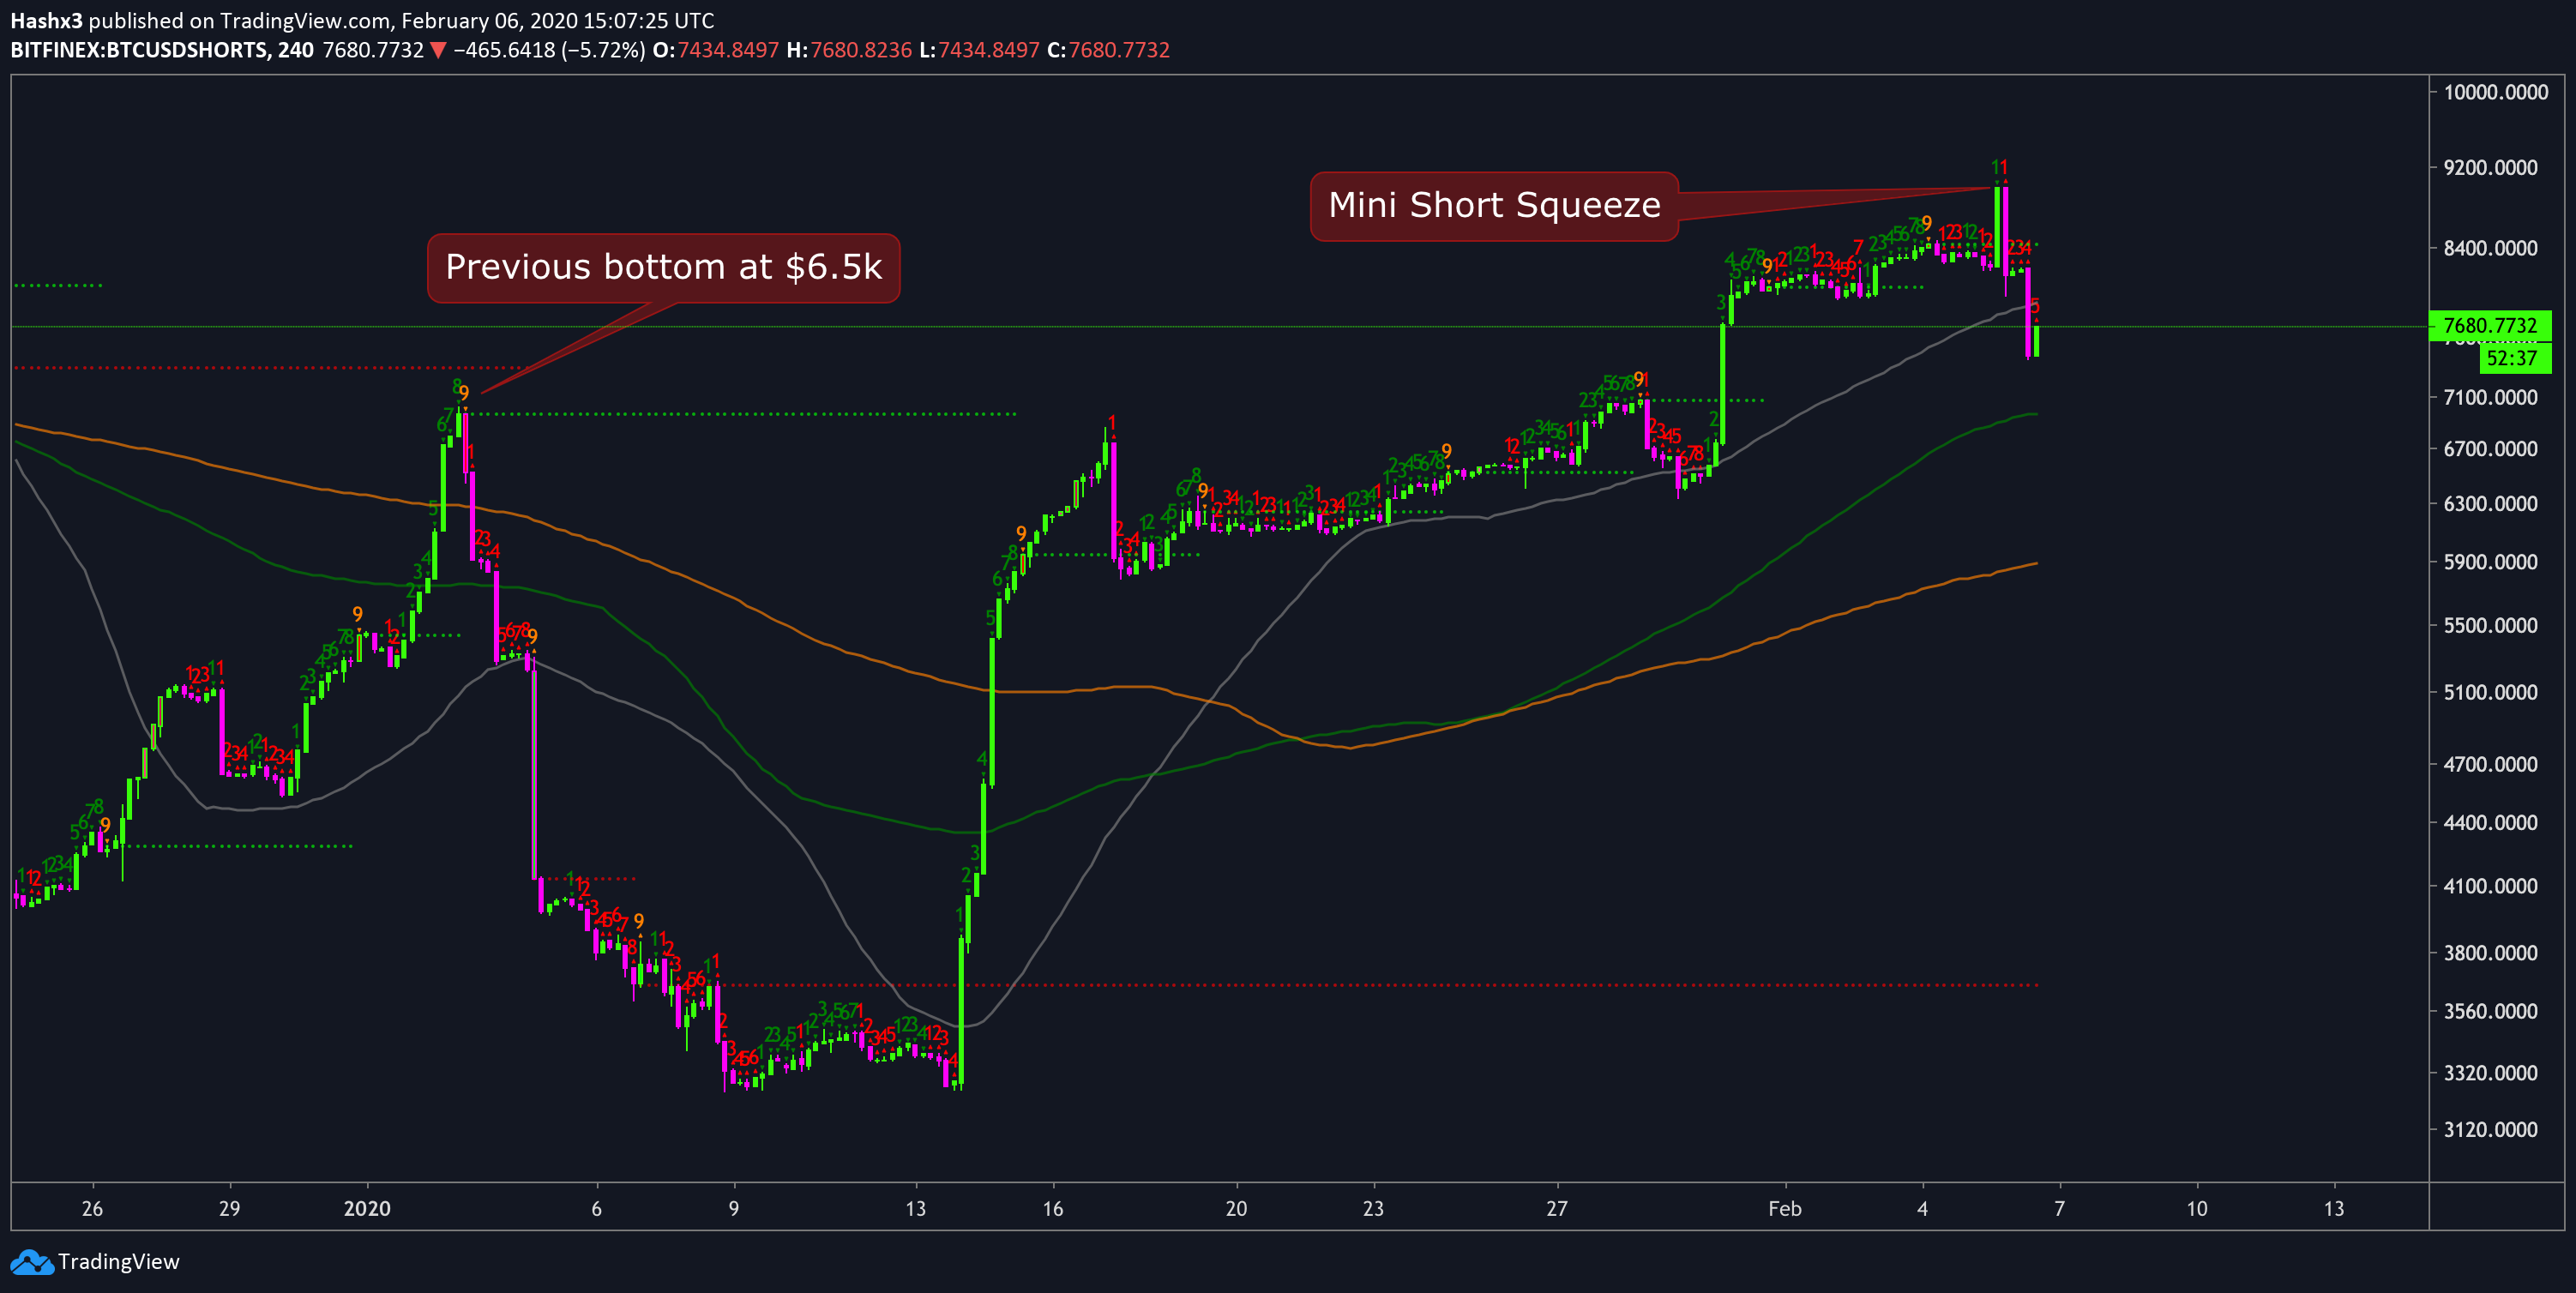
When we look at the amount of shorts in the market, we can attribute our recent price increase to a mini short squeeze. Additionally, we have the highest amount of shorts in the market since price bottomed at $6.9k on Jan 3. If price continues to increase, it may lead to a larger short squeeze that launches us well into the $10k price range.
Conclusion
Current indicators are leaning heavily bullish for the next week. While we may experience some profit taking in the interim, the overall trend remains very bullish from a daily and weekly timeframe.