
Cryptocurrency
Trading Bitcoin: Massive Decline or Recovery Incoming?
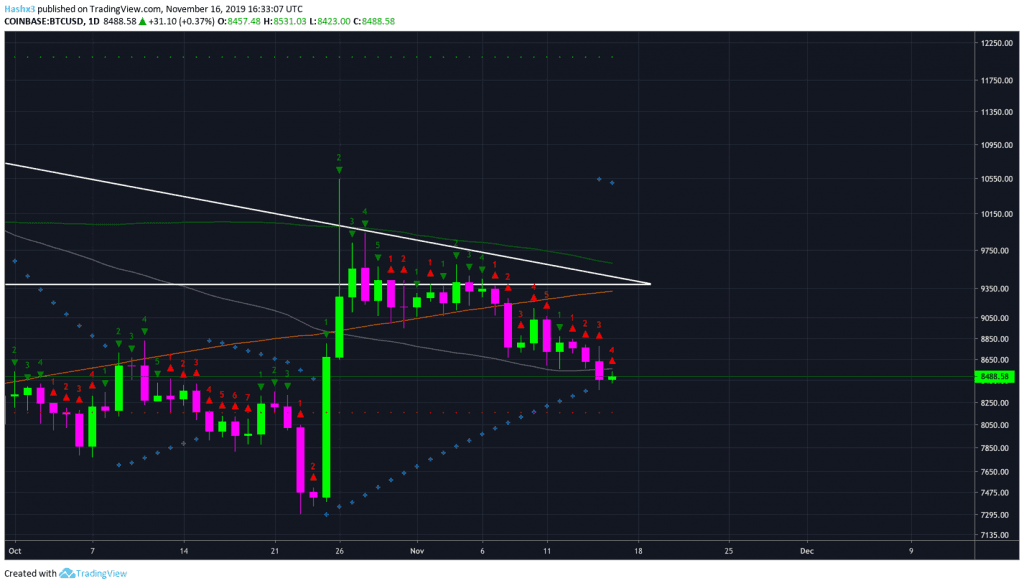
Massive Decline Incoming? On the daily chart above, Bitcoin is on a red 4 on the sequential indicator. Therefore, the next 5 days are likely to be bearish based on sequential theory. Additionally, price has very little support below the $8.1k price channel. This level is also lined with the sequential setup trend line from […]
Massive Decline Incoming?
On the daily chart above, Bitcoin is on a red 4 on the sequential indicator. Therefore, the next 5 days are likely to be bearish based on sequential theory. Additionally, price has very little support below the $8.1k price channel. This level is also lined with the sequential setup trend line from the previous red 9 candle.
4 Hour Heikin Ashi
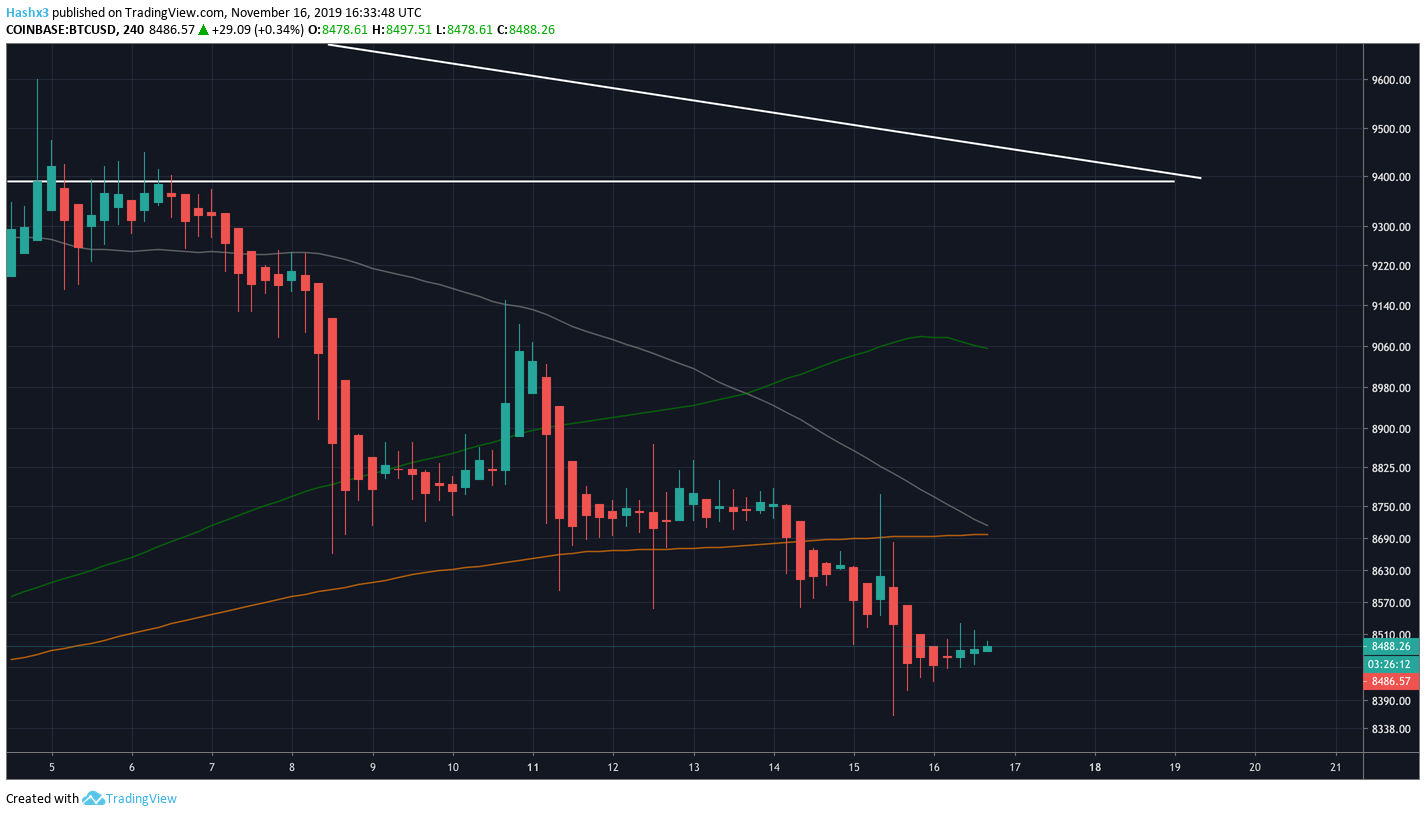
The four hour chart is mildly bullish as we have now received 3 green heikin ashi candles in the last 12 hours. We have not received 12 straight hours of green candles since before the downtrend. This may be a foreshadowing to a bullish trend change.
4 Hour
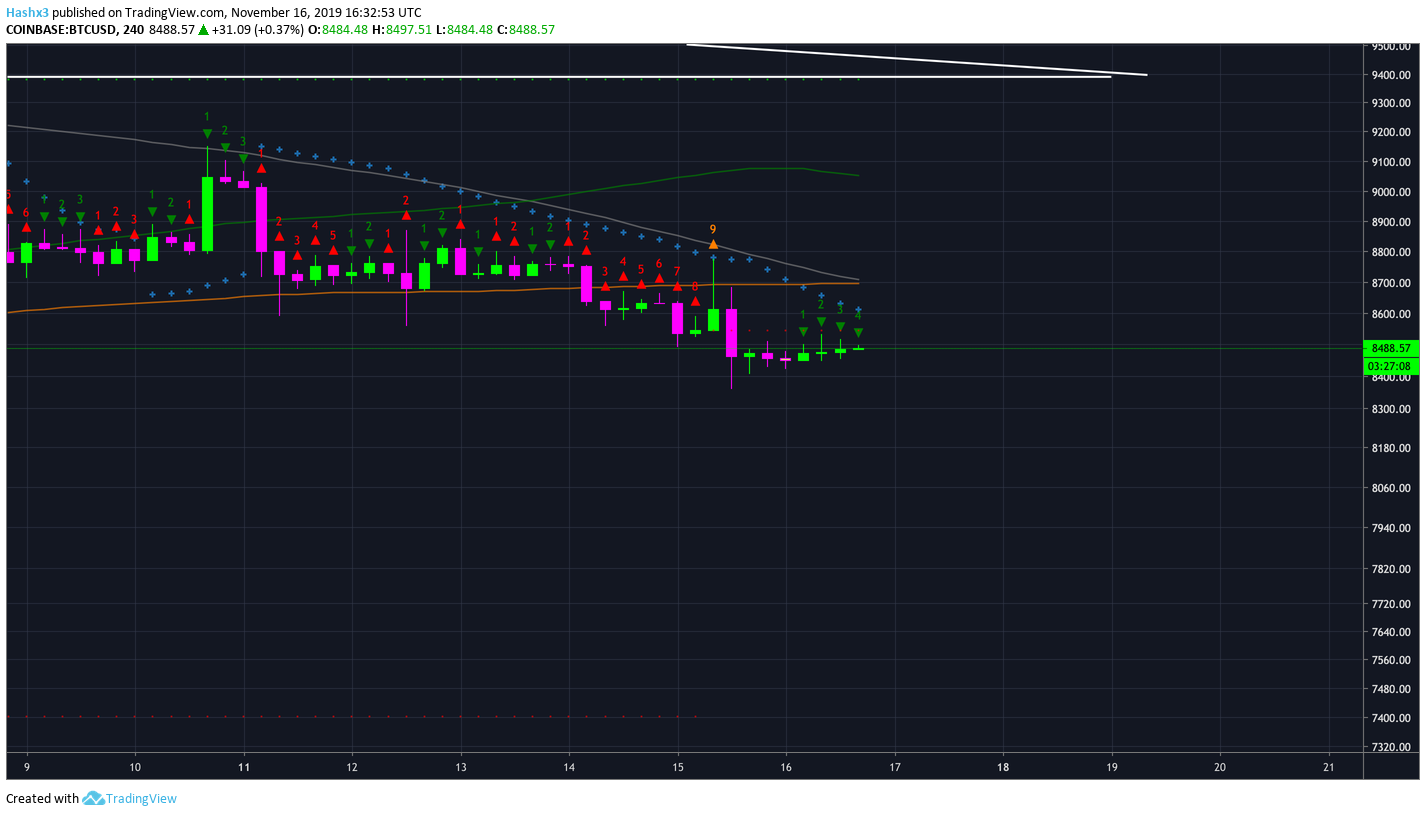
Bitcoin is now on a green 4 candle on the 4 hour chart above. However, the Lucid SAR and the 200MA (orange) are still acting as bearish resistance above price.
Conclusion
As bearish stagnation continues, we are beginning to see some mildly bullish indicators on the 4 hour chart. Bulls must remain above support at $8.2k. $9k is acting as critical resistance.
Disclaimer: The author of the article hodls Bitcoin.