
Cryptocurrency
Trading Bitcoin: More Bearish Signals
More Bearish Signals The daily chart above continues to present bearish indicators as price remains flat. Notably, Bitcoin continues to close below the 200MA (orange). Additionally, Bitcoin formed a doji candle yesterday which is typically characteristic of a trend reversal. If our current candle closes below the doji, according to candlestick theory, price will have […]

More Bearish Signals
The daily chart above continues to present bearish indicators as price remains flat. Notably, Bitcoin continues to close below the 200MA (orange). Additionally, Bitcoin formed a doji candle yesterday which is typically characteristic of a trend reversal. If our current candle closes below the doji, according to candlestick theory, price will have bearish momentum in the interim. Also, the 50MA (grey) recently intersected the 128MA (green) to create a death cross. A death cross in traditional technical analysis is considered a significant bearish indicator. However, we must not forget that moving averages are lagging indicators. While the sequential indicator is on a green 3, it is unlikely that price will experience significant bullish momentum anytime soon.
Monthly
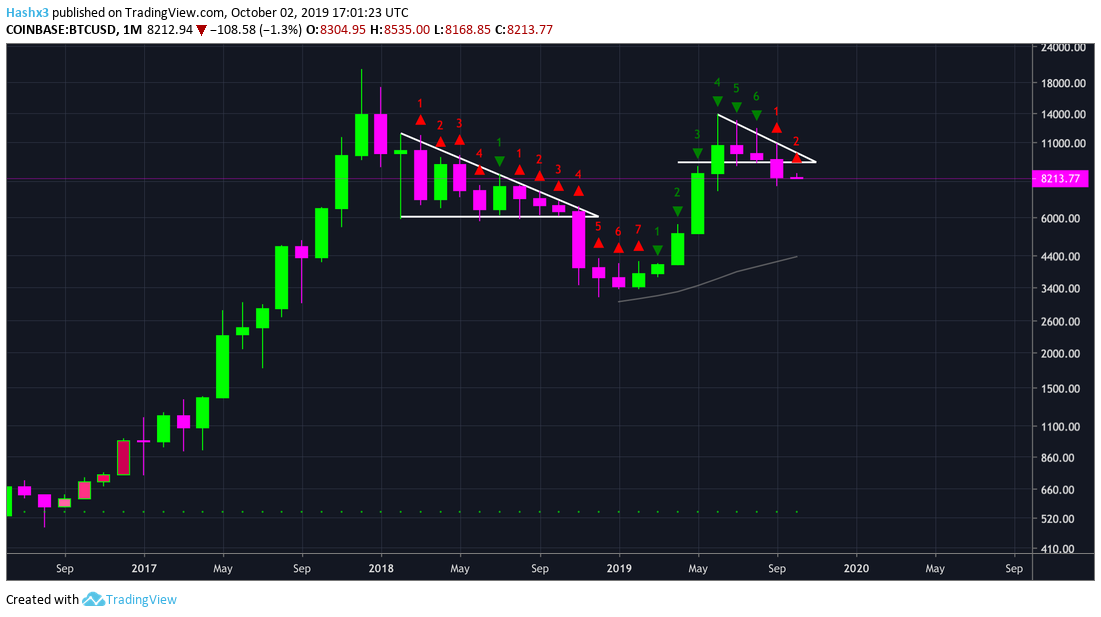
Now that we are in the month of October, Bitcoin has formed a red 2 on the monthly chart above. While there are 29 more days of October, price may close below the previous red 1 candle activating a severely bearish signal on the macro trend.
Hash Rate
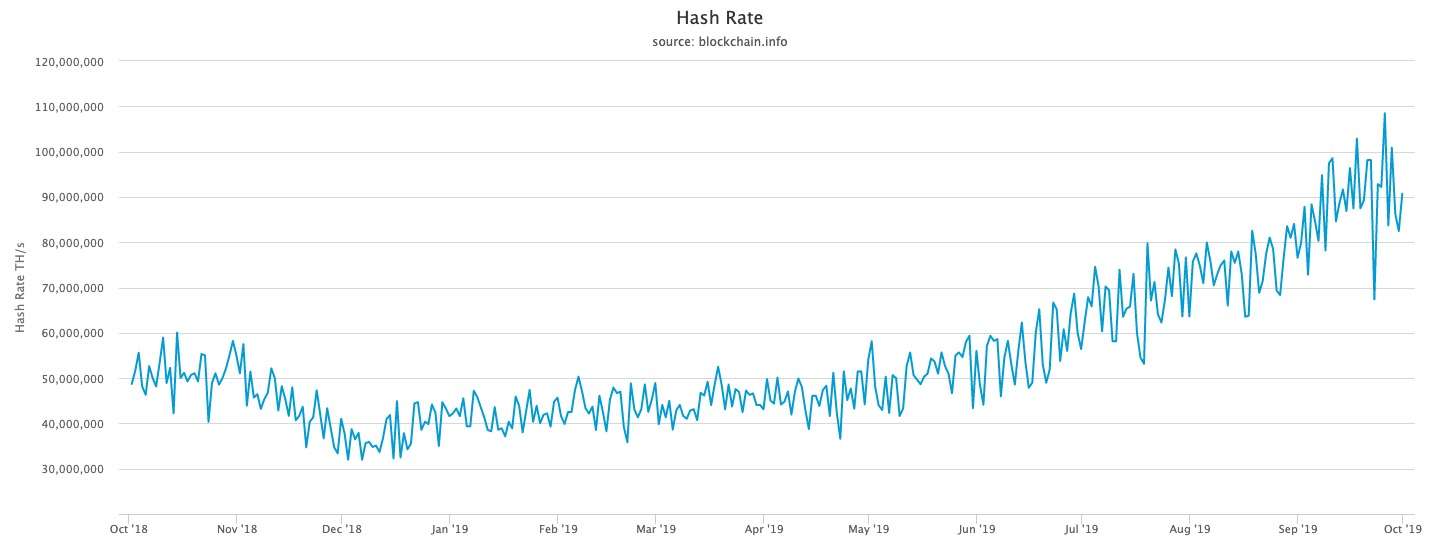
From the chart above, you can see the overall hash rate of the Bitcoin network. After last week’s decline, hash rate has decreased slightly. Overall, miners remain bullish on the future price of Bitcoin.
Conclusion
More bearish signals are emerging as price remains flat. With price below the 200MA and a doji candle on the daily chart, there is little technical reason to be bullish at the present time. At Market Rebellion, we are watching October 5th as a critical date for a reversal. We expect Bitcoin to increase or remain flat until this time.