
Cryptocurrency
Trading Bitcoin: Pop or Drop?
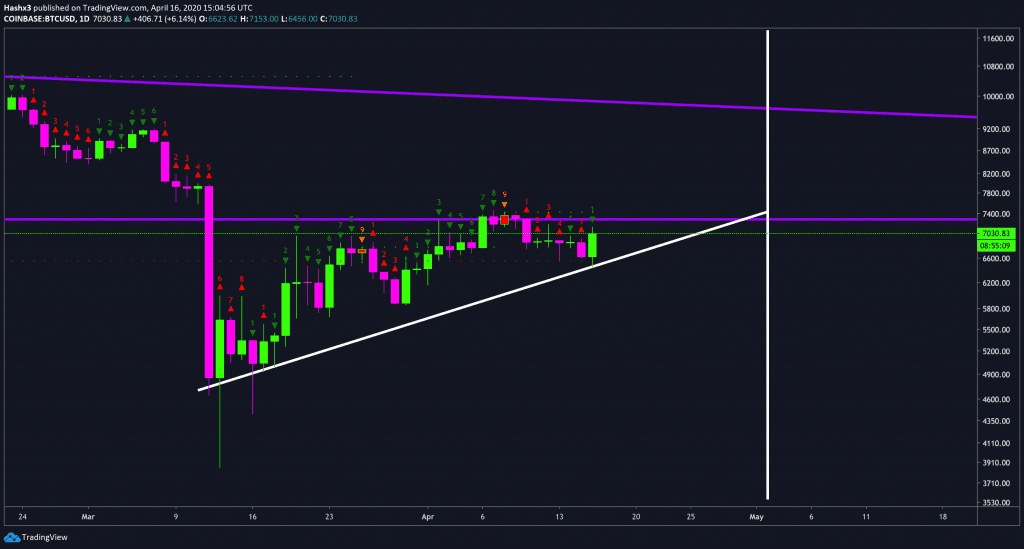
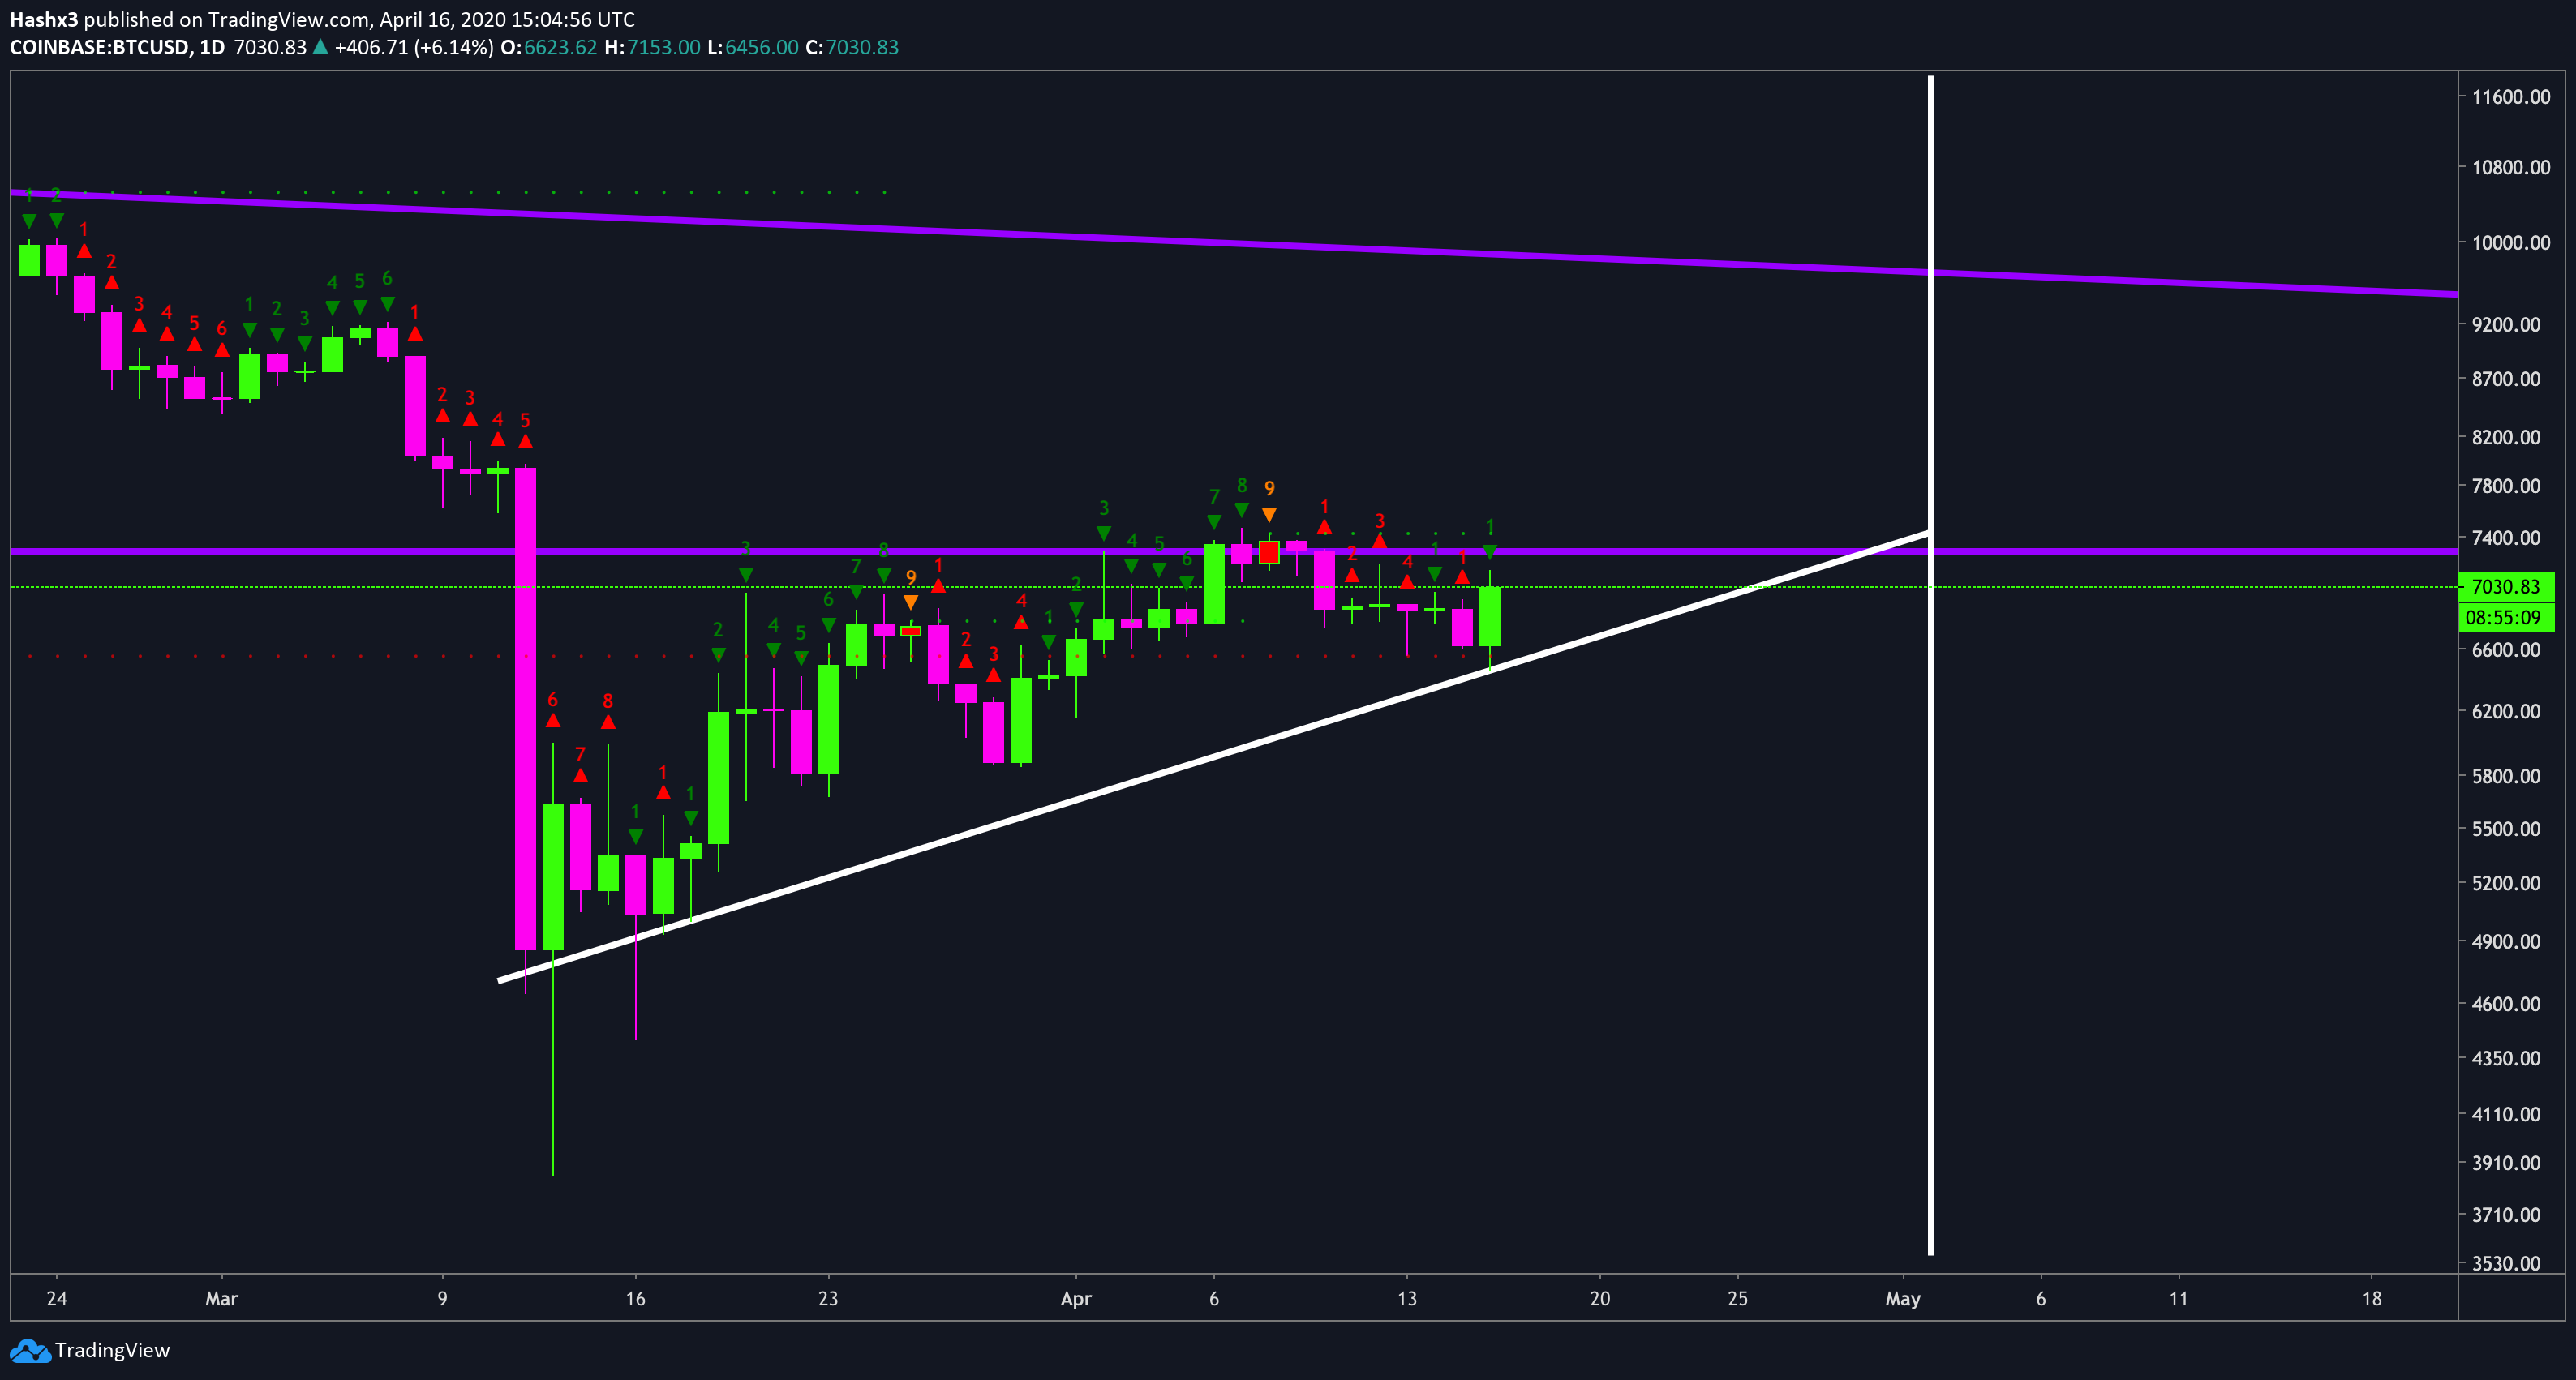
Daily Price has now perfectly bounced off the upward sloping trendline (white line). Additionally, the sequential indicator has just undergone a price flip to a green 1. Therefore, if we get a green 2 tomorrow which opens above our current green 1 candle, that’s a strong indication price will break out of the ascending triangle […]
Daily
Price has now perfectly bounced off the upward sloping trendline (white line). Additionally, the sequential indicator has just undergone a price flip to a green 1. Therefore, if we get a green 2 tomorrow which opens above our current green 1 candle, that’s a strong indication price will break out of the ascending triangle to a price target of $7.8K. However, if the upward sloping trend line is broken, that is a very bearish indication which may mean new interim lows.
4 Hour (Heikin-Ashi Candles)
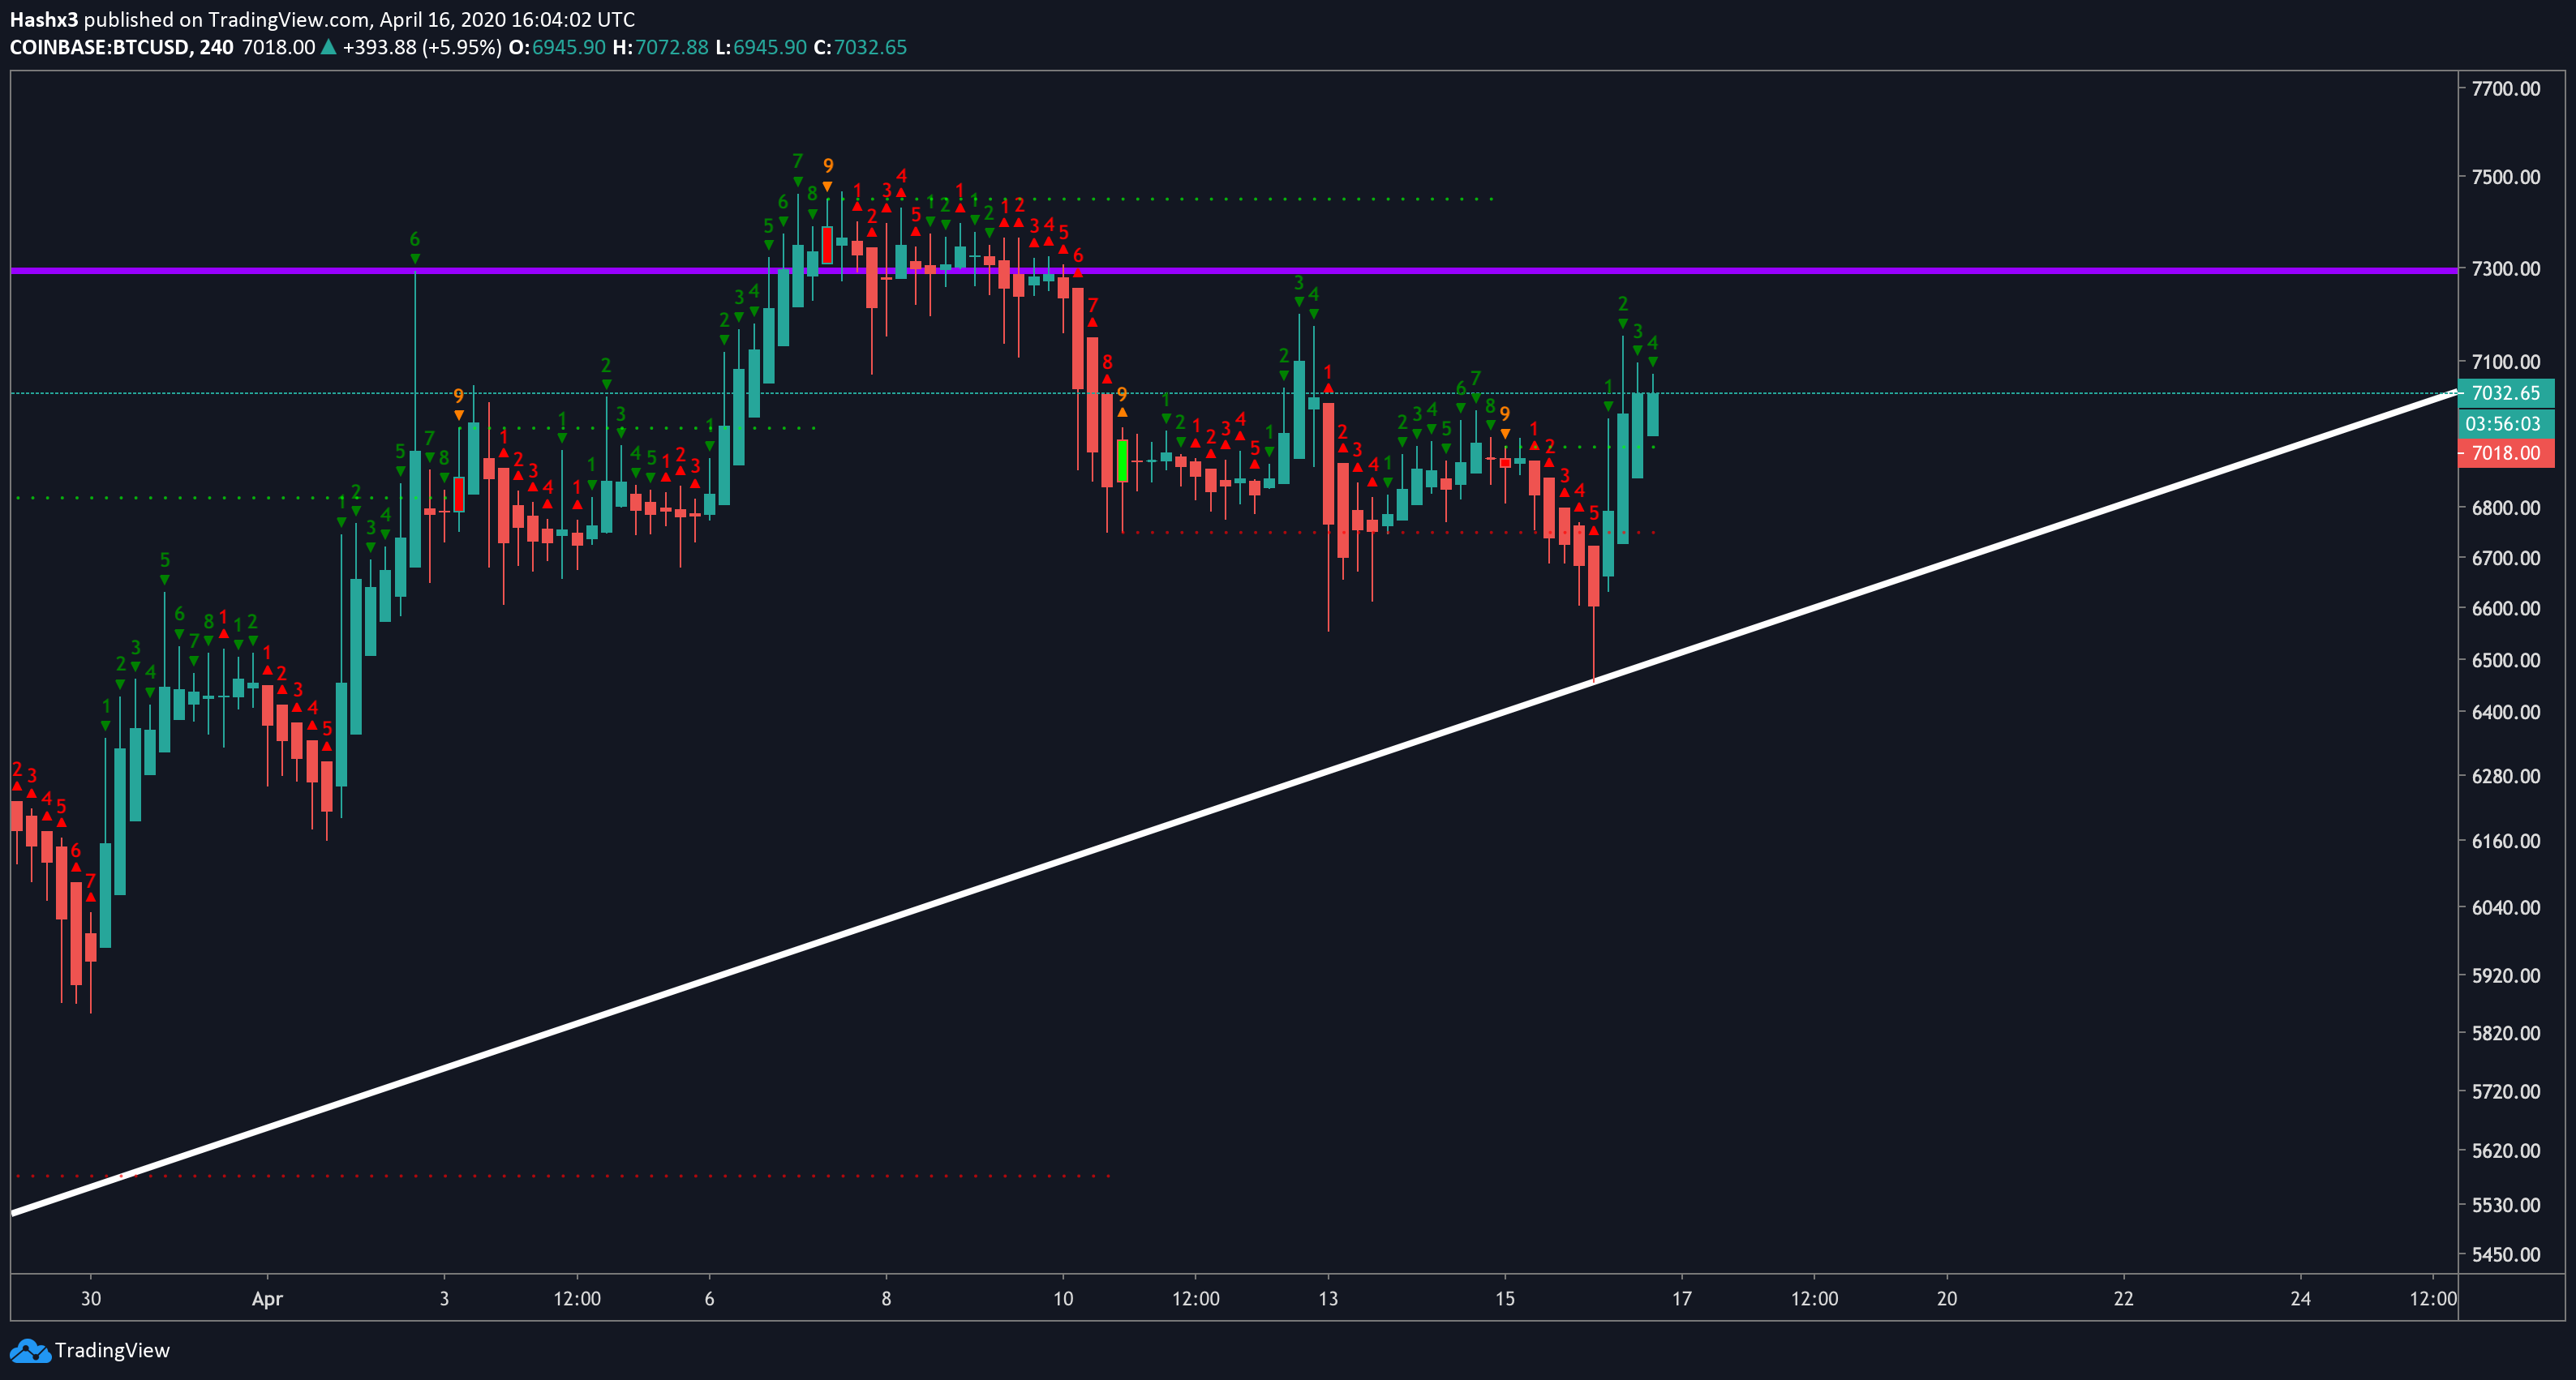
On the 4 hour chart above, we can see that Bitcoin is on a bullish green sequential 4. Therefore, price is likely to continue creating green numbers until the trend reaches a green 9.
$SPX Daily
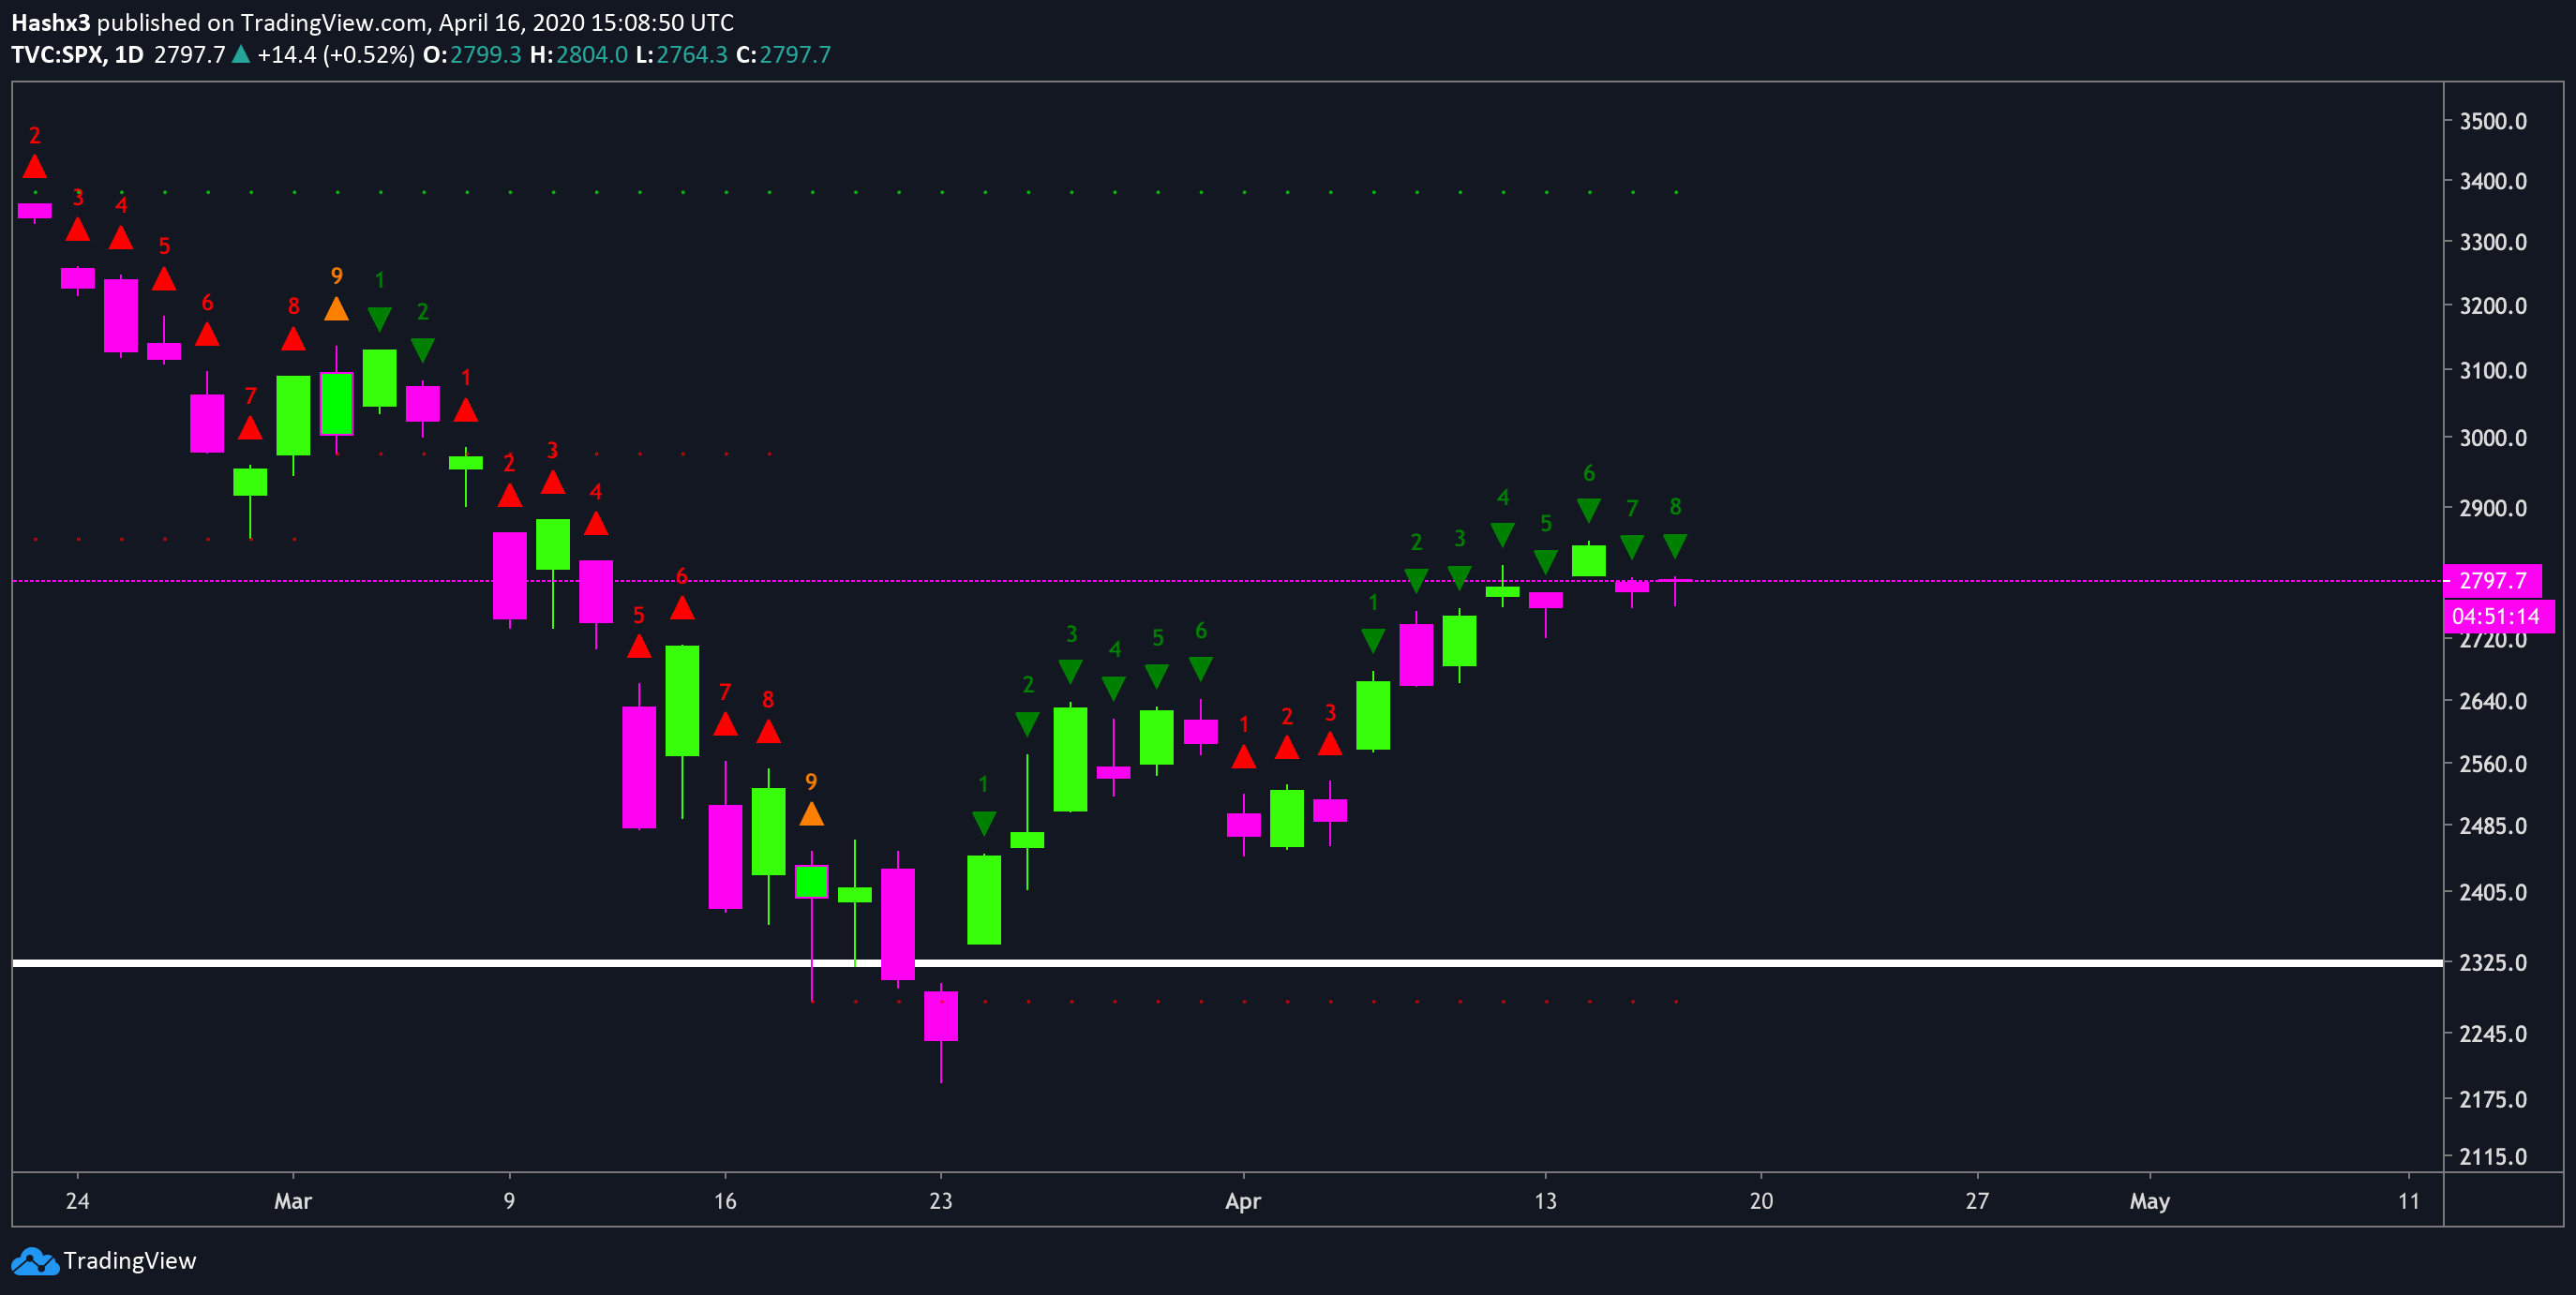
The S&P 500 reaches a daily green 9 tomorrow. In sequential theory, this is known as a ‘sell’ 9 and may lead to relative profit taking for traders and investors. The SPX and Bitcoin have been very correlated throughout the recent market downturn, therefore, a large drop in the SPX tomorrow would likely affect Bitcoin in a negative way.
Conclusion
While Bitcoin technicals are relatively bullish for the next few days, the SPX may sell off hard tomorrow which may result in a lower Bitcoin price.
Disclaimer: The author of the article hodls Bitcoin.