
Cryptocurrency
Trading Bitcoin: Price Crashes on a Daily 9
Price Crashes on a Daily 9 When the sequential indicator reaches a 9, it usually results in a large move. Based on the previous posture of the trend, this large move was likely to be a bearish continuation. In previous videos we asserted that our outlook was 60% bearish and 40% bullish. Now support is […]

Price Crashes on a Daily 9
When the sequential indicator reaches a 9, it usually results in a large move. Based on the previous posture of the trend, this large move was likely to be a bearish continuation. In previous videos we asserted that our outlook was 60% bearish and 40% bullish. Now support is barely holding $7.6k. If this final line of support is broken, traders are likely to drop price to $5.5k-$6k. This would create an ideal ‘buy the dip’ scenario before the halving.
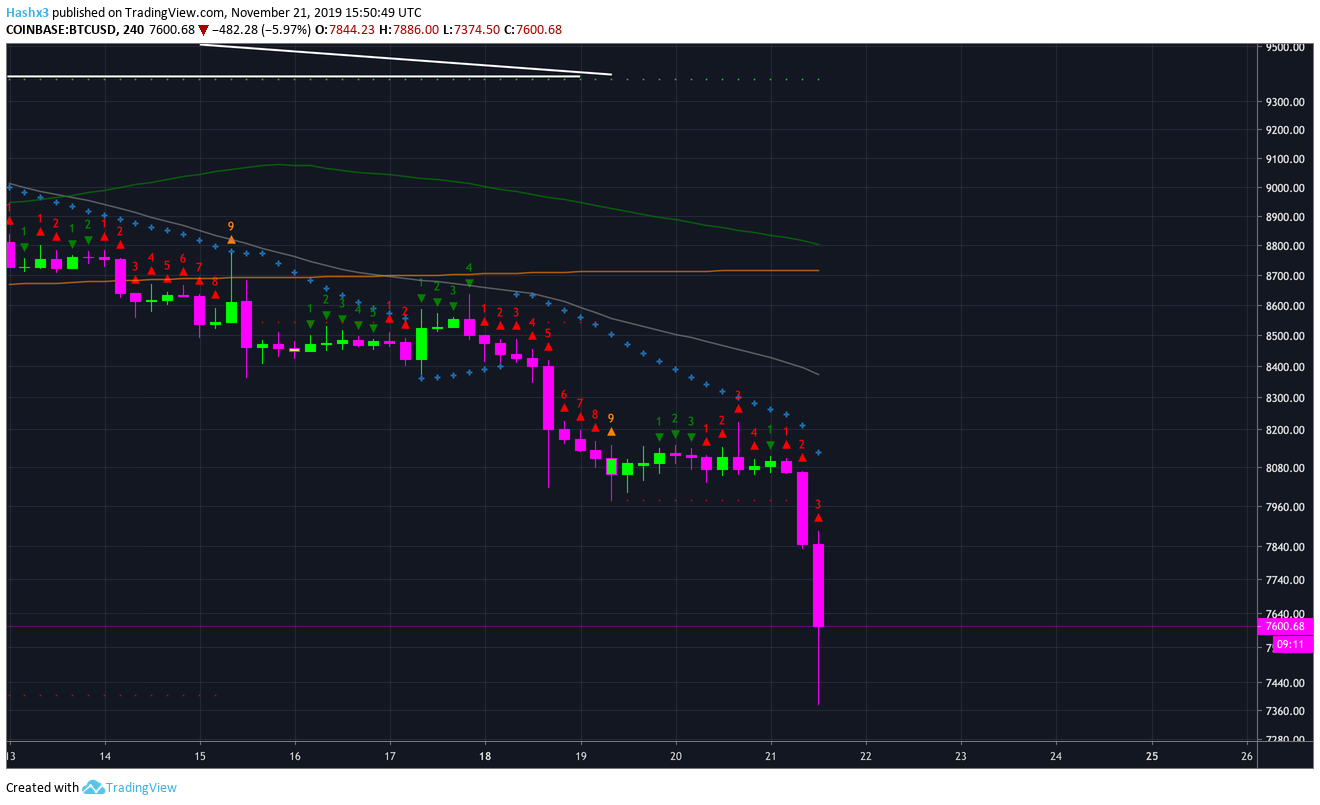
4 Hour
Bitcoin is on a red 3 candle on the 4 hour chart above. Price dropped on a red 2. In sequential theory, a red 2 candle which closes below the previous red 1 candle is an indication to place a short trade. Support has to hold above the $7.6k price region, or else a large decline to the $6k price region is expected.
Conclusion
Bitcoin has fallen drastically after reaching a red 9. Support stands at $7.6k. Current resistance remains at $8k.
Disclaimer: The author of the article hodls Bitcoin.