
Cryptocurrency
Trading Bitcoin: Price Crashes to $8.6k, What Now?
Daily The Dow Jones had its worst 2-day drop in 2 years. Meanwhile Bitcoin has dropped 13% in the last two days amidst the broad market sell off. Now Bitcoin is on a red 2 of 9 candle on the daily chart above. In sequential theory, a red 2 which closes below the previous red […]

Daily
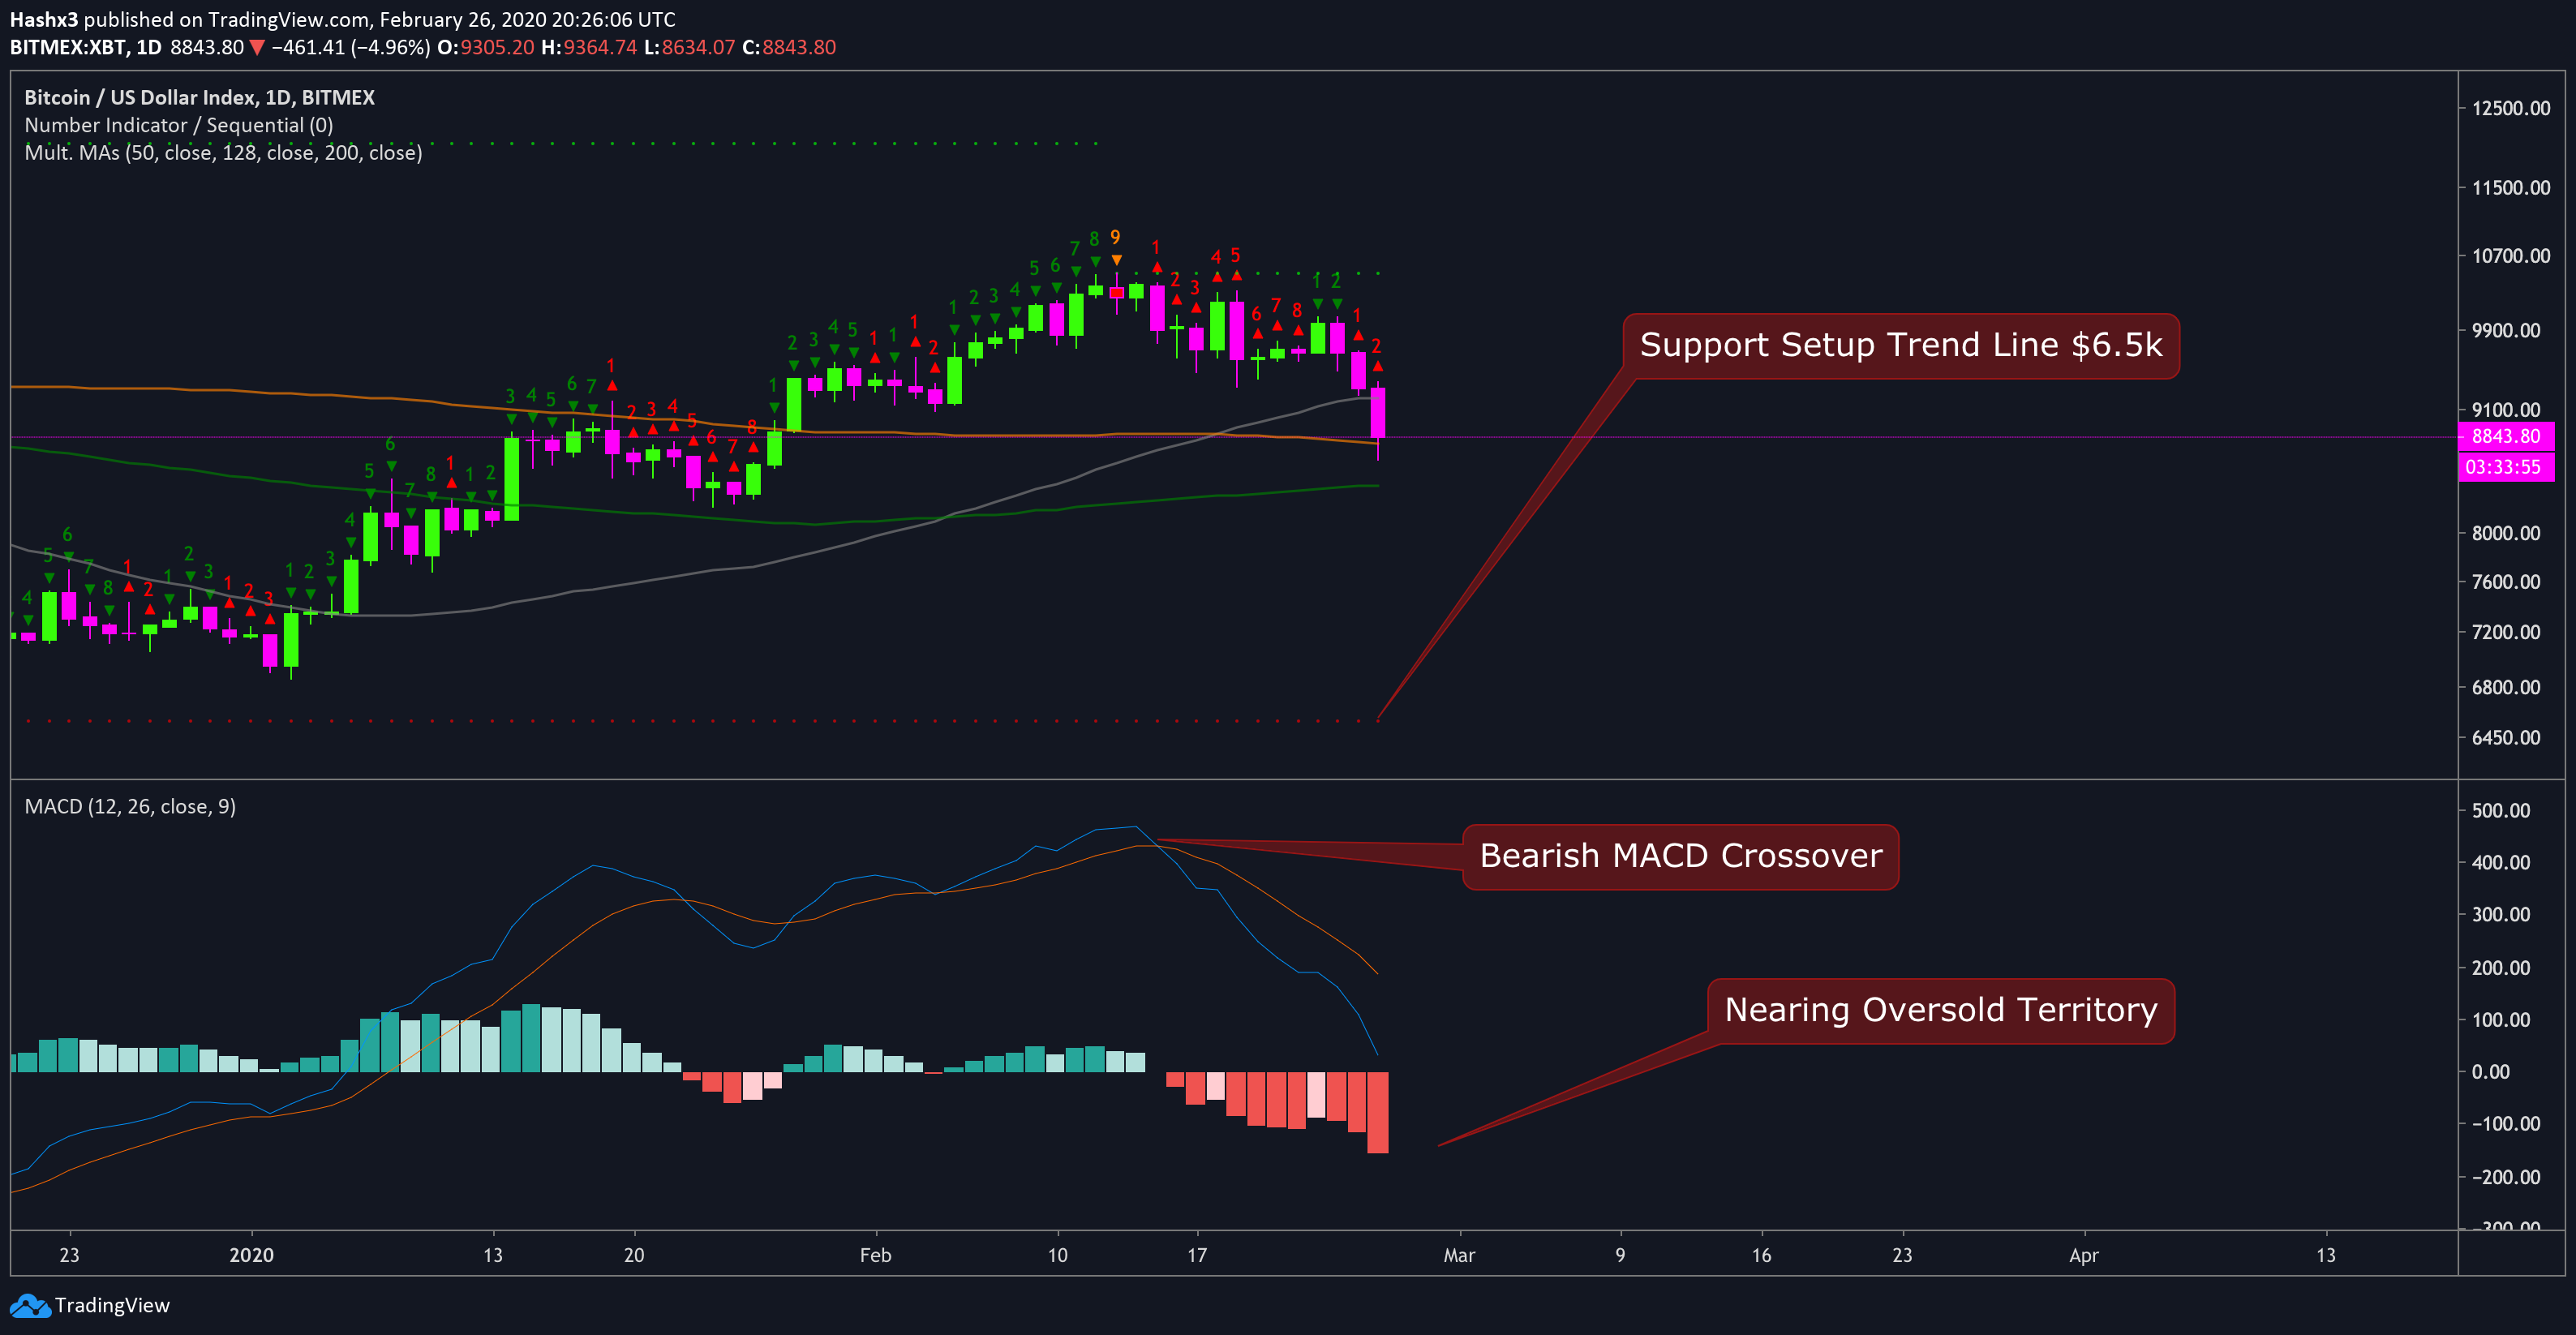
The Dow Jones had its worst 2-day drop in 2 years. Meanwhile Bitcoin has dropped 13% in the last two days amidst the broad market sell off. Now Bitcoin is on a red 2 of 9 candle on the daily chart above. In sequential theory, a red 2 which closes below the previous red 1 is an indication to place a short trade. However, price is holding strong at the 200MA (orange) so, I personally, would not place a short trade on this kind of red 2. I would prefer to be in cash while the market stabilizes. Additionally, the RSI is reaching relatively oversold levels on the daily chart. Overall, it is looking like the 200MA (orange) is going to hold support.
 Daily
Daily
If support cannot hold, the next available support level does not occur till $6.5k. This level is based off the previous set up trend line from the sequential indicator. To add to the bearish case, priced experienced a harsh sell off after the MACD made a bearish crossover. Currently the MACD is nearing oversold territory.
Catching a Falling Knife – 4 Hour
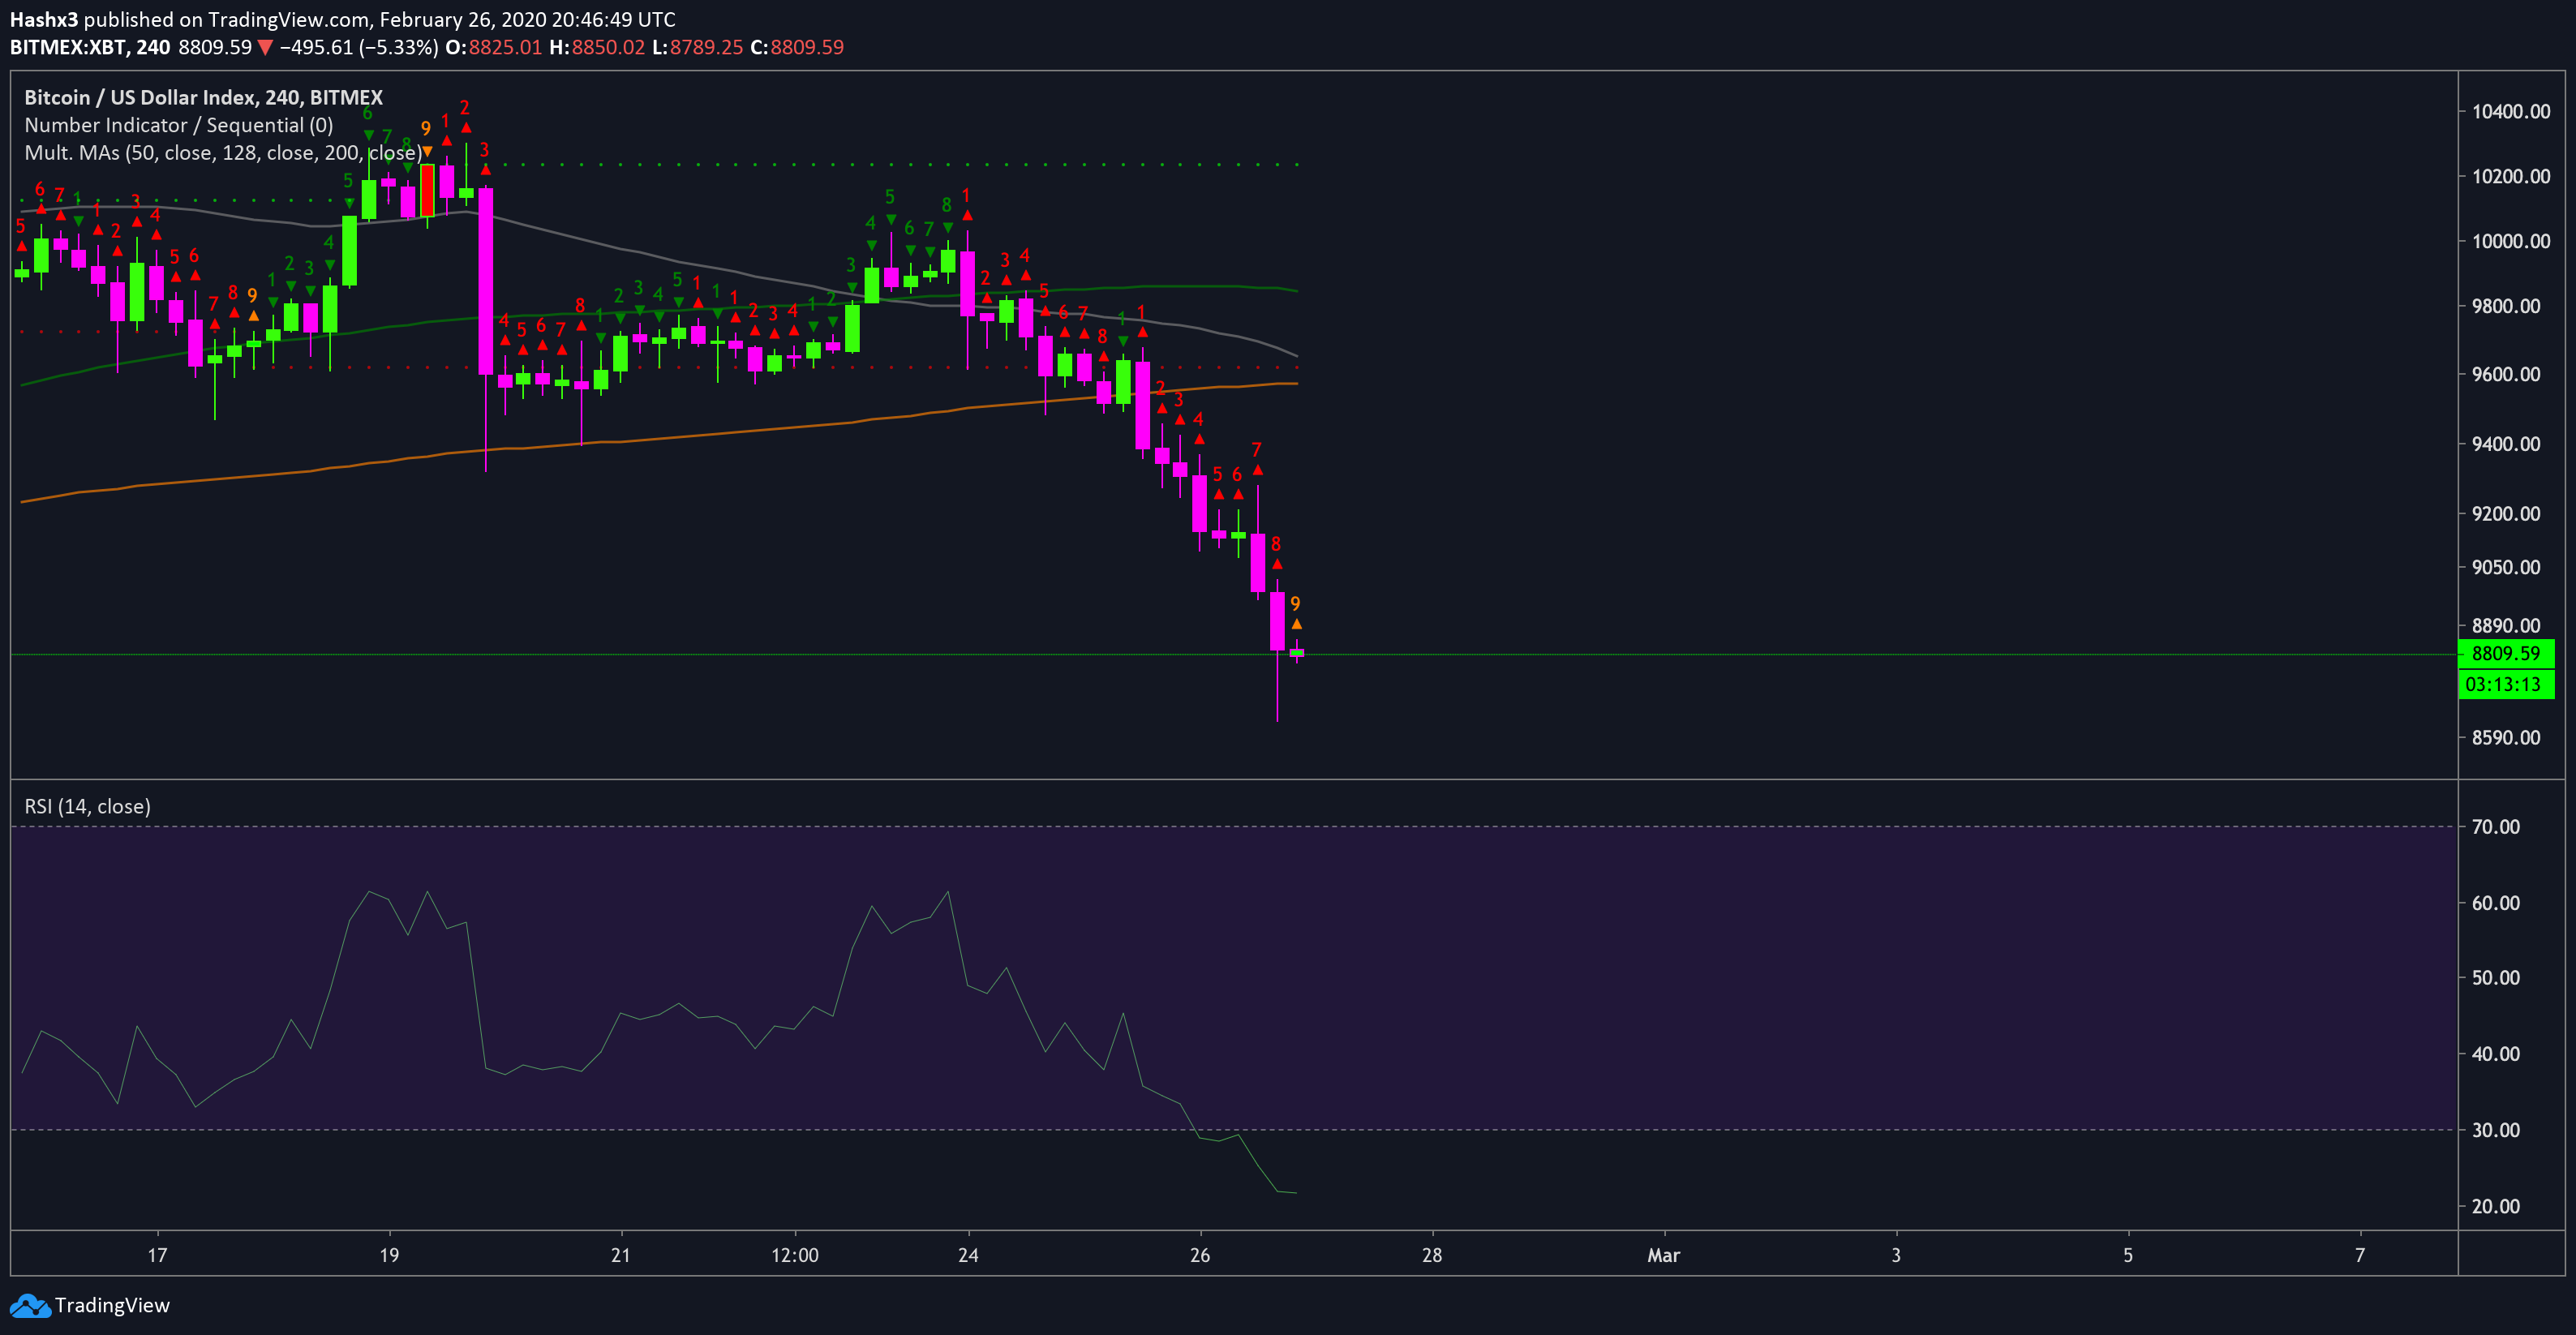
Bitcoin is reaching a red 9 on the sequential indicator. Typically, a 9 is characteristic of a trend reversal in sequential theory. Additionally, the RSI is in severely oversold territory. Overall, sequential is telling you to consider a long trade by catching a falling knife. Tom DeMark created the sequential indicator for institutional buying and selling in large quantities. Therefore, it specializes in selling into strength in mass and buying into weakness in mass.

Crypto Fear and Greed Index
As you can see above, the fear and greed index has gone back into fearful territory. Still, the index has plenty of room to the downside if we experience another sell off, nevertheless, it’s telling us the herd is beginning to sell and is fearful. As traders, we recognize that generally, the herd is wrong.
Conclusion
After a harsh sell off over the course of the previous two days, we expect a reaction rally on the 4 hour chart following a red 9. If the trend reverses on the 4Hr 9, the next resistance level would stand at $9.5k. Current support remains at $8.6k.