
Cryptocurrency
Trading Bitcoin: Price Reaches Daily 9
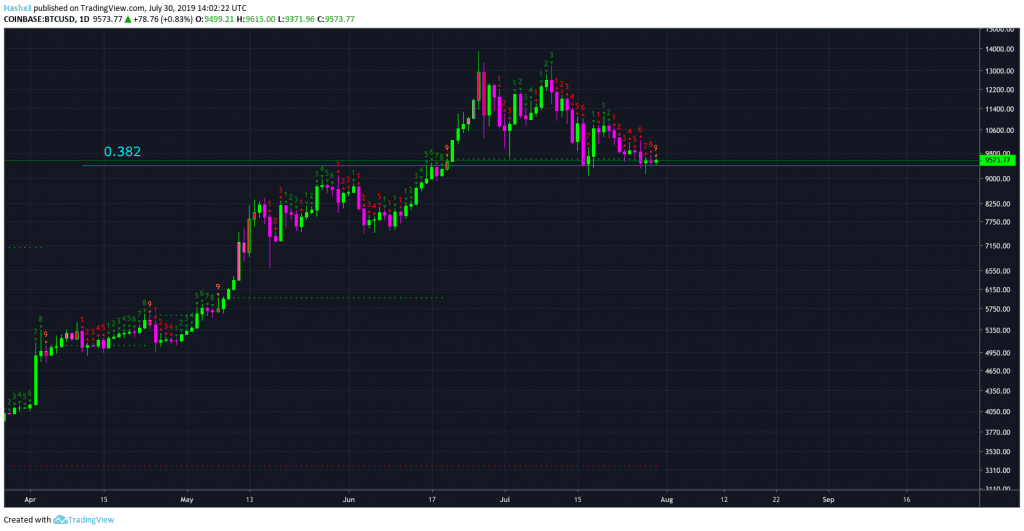
Price Reaches Daily 9 On the daily chart above, you can see price has reached a red 9 candle just above the 0.382 fibonacci support level. Conventionally, a red 9 is an opportunity to catch a falling knife. However, the current 9 candle has closed below the previous setup trend line (dotted green line) which […]
Price Reaches Daily 9
On the daily chart above, you can see price has reached a red 9 candle just above the 0.382 fibonacci support level. Conventionally, a red 9 is an opportunity to catch a falling knife. However, the current 9 candle has closed below the previous setup trend line (dotted green line) which typically leads to a 1-4 green candle correction. This 1-4 candle correction is usually followed by 9 more days of downward price action. Keep in mind, this rule of sequential theory works for both bearish and bullish conditions.
4 Hour
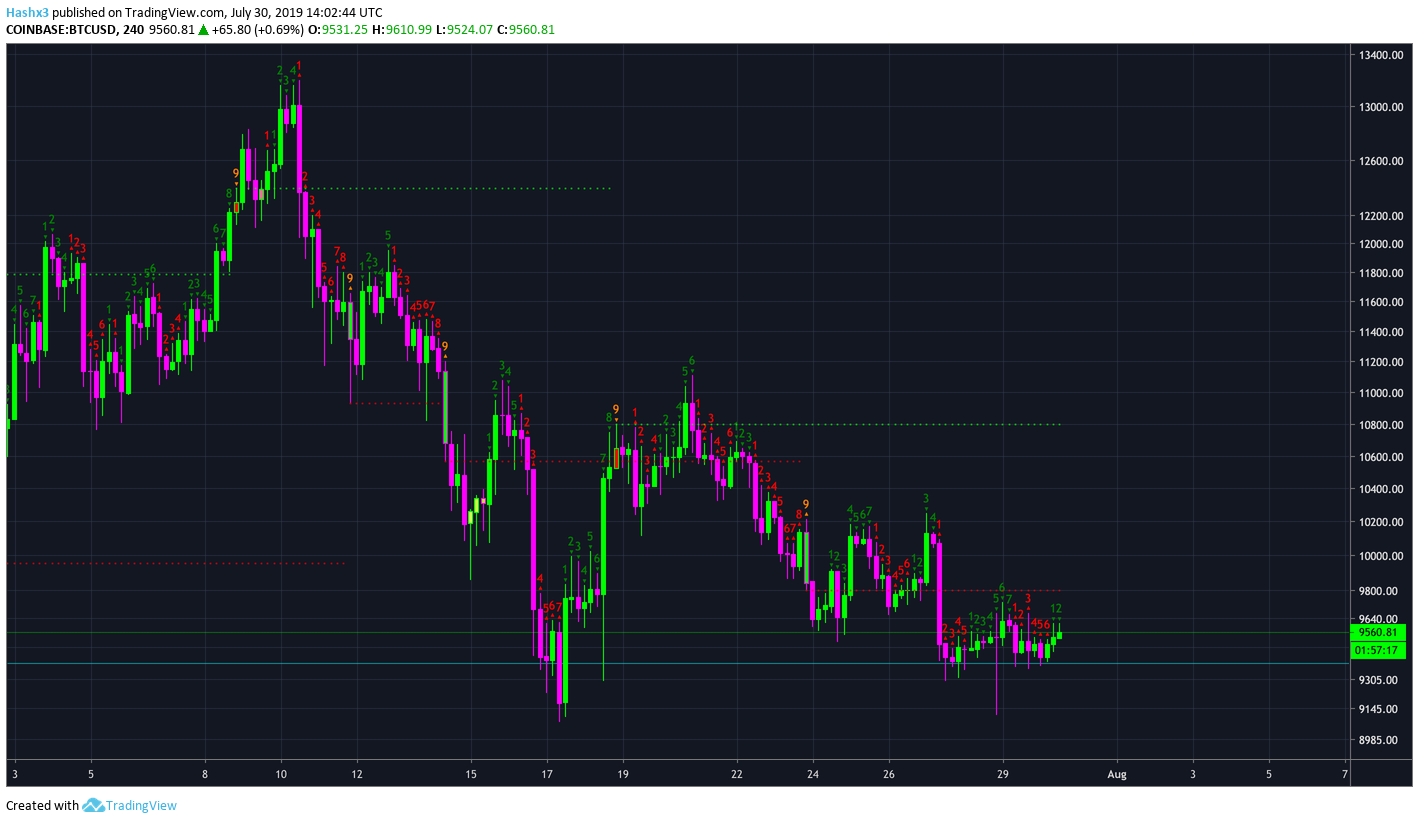
The sequential indicator on the 4 hour chart above is currently on a green 2 above a green 1. If this 2 candle closes at or above its current price, that is an indication to place a long trade on a 4 hour time frame. If you are short from a daily or weekly timeframe, it’s probably time to get flat.
Weekly
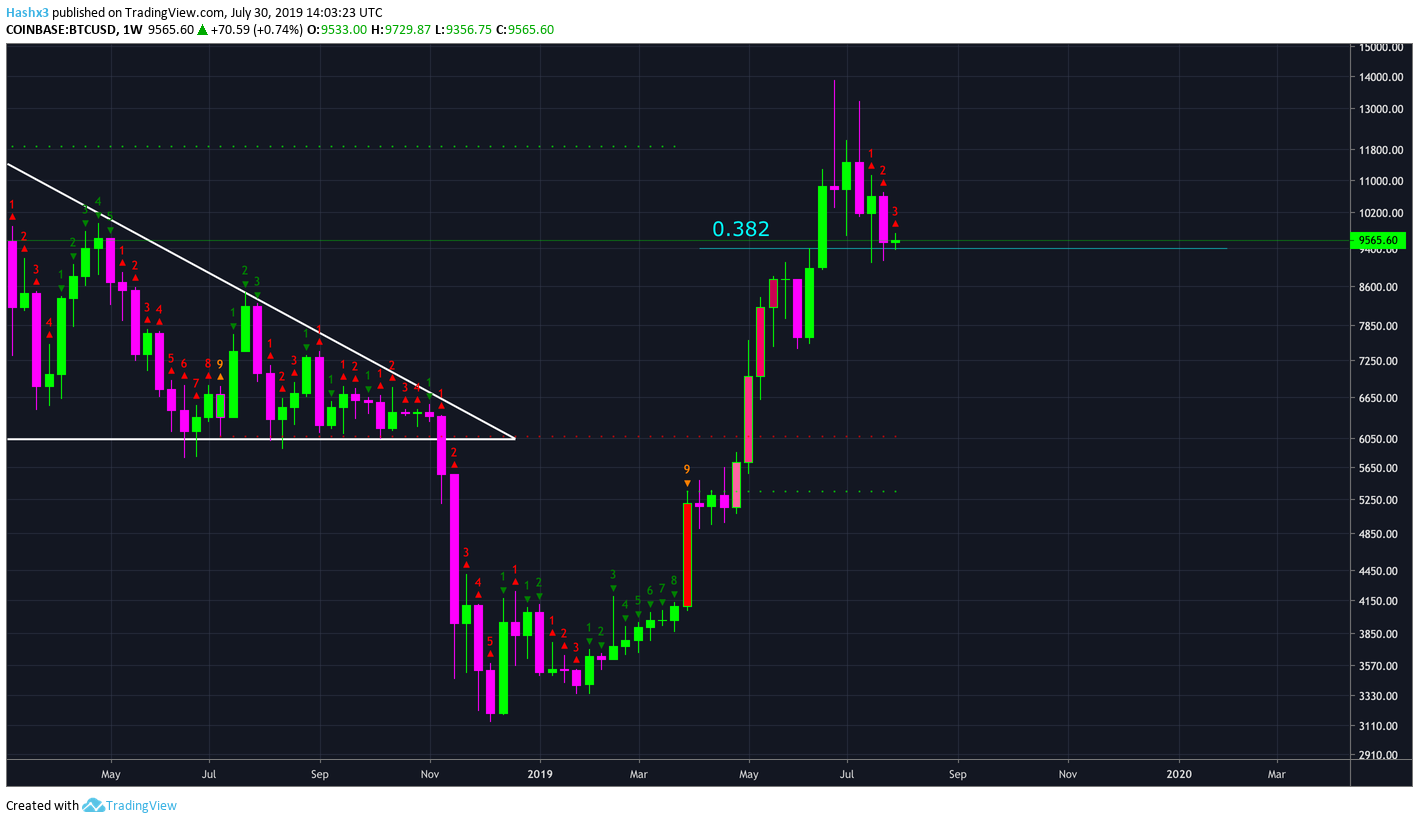
As you can see, Bitcoin is on a red 3 of 9 candle on the weekly chart above. This red 3 is notable because Bitcoin has not recorded a red 3 on the weekly chart since the February low of $3.3k. Throughout Bitcoin’s entire spring uptrend, price never recorded a red 3. Furthermore, downward price action is looming.
Dollar Index (DXY) Daily
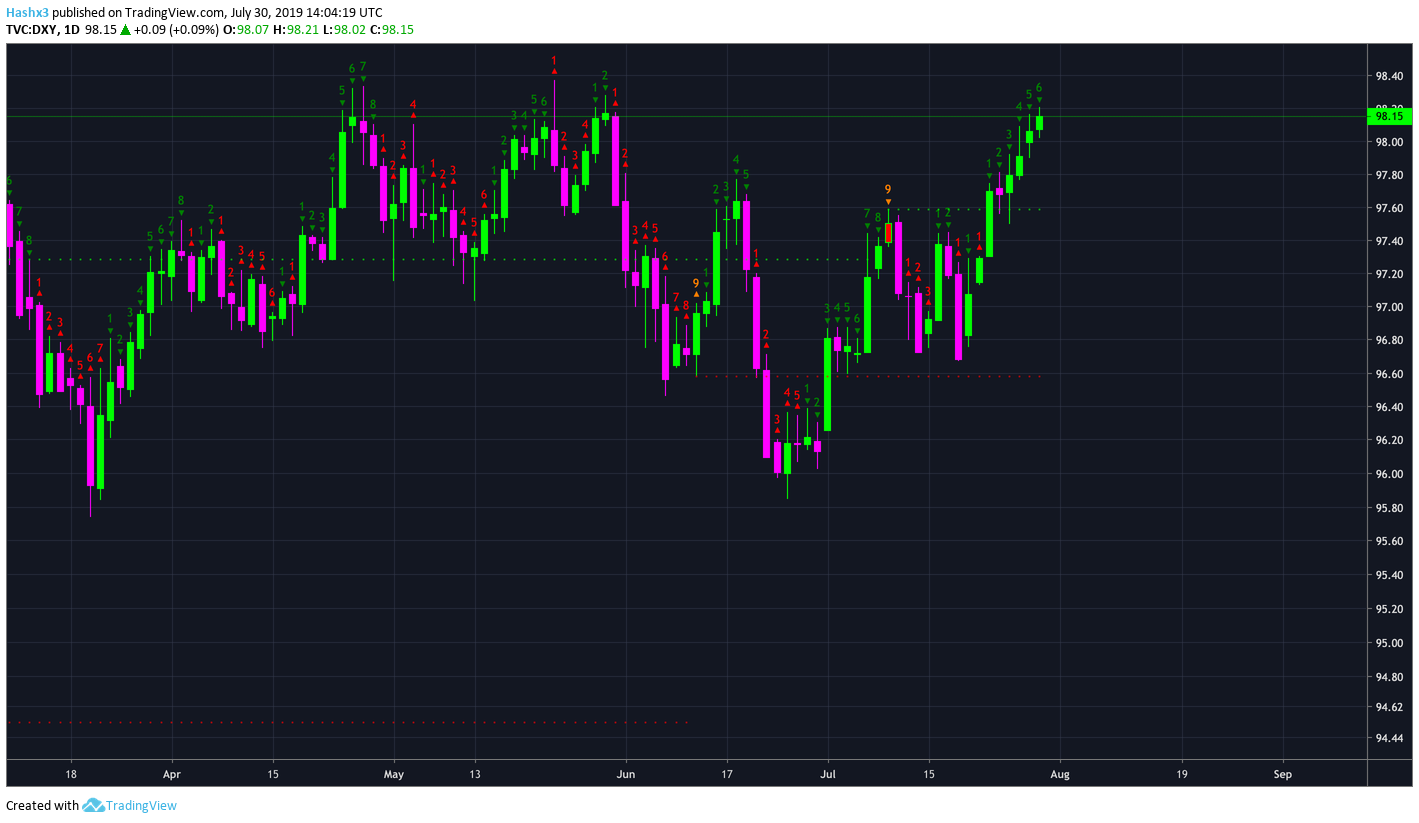
We’ve been following the DXY since it recorded a green 2 going above a green 1. Currently, price is on a green 6 of 9 candle and looks very bullish. If the Dollar continues its bullish momentum it will soon create a new yearly high. This price action is presumably bearish for Bitcoin and many other currencies.
EURO/USD Weekly
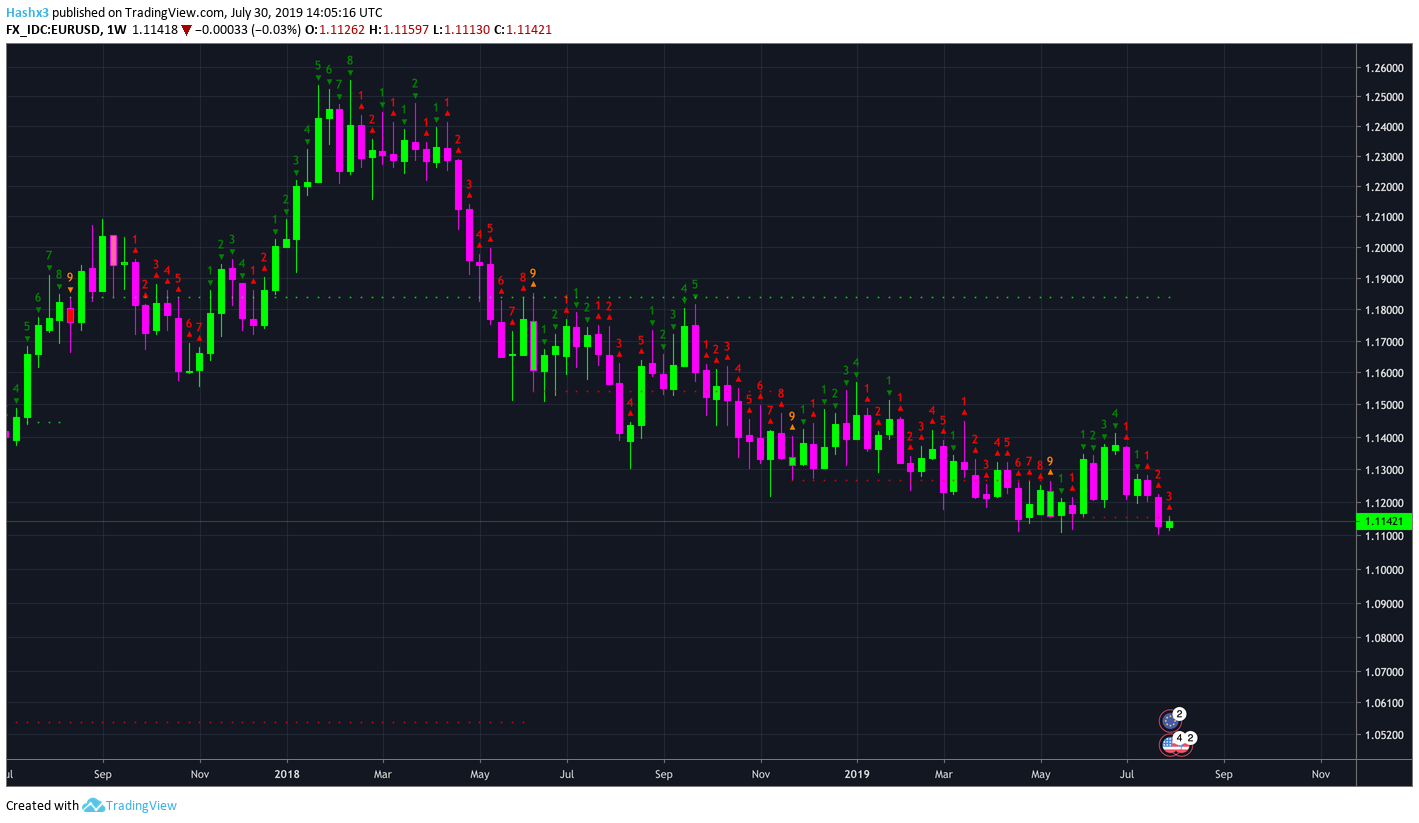
The Euro has slumped relative to the US Dollar for a significant period of time. With a red 2 going below a red 1 a short trade was activated with last week’s candle. For the next month, the Euro is bearish and the dollar is bullish.
Gold/oz Weekly
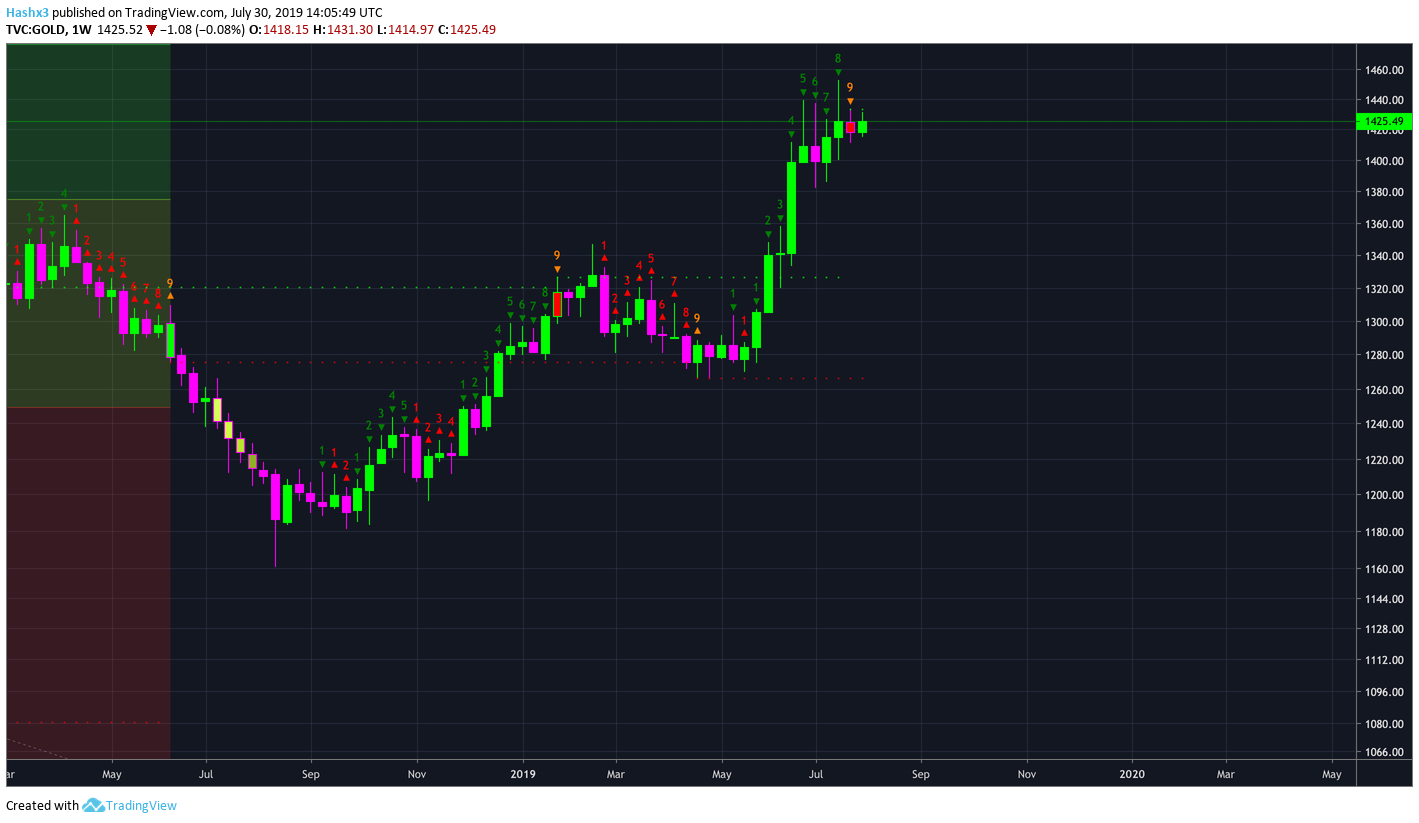
Gold reached a green 9 candle last week. With the strengthening dollar and the parabolic rise in gold, it seemed that gold was due for a pullback. However, if gold creates a green 2 next week above our current green 1, sequential will be bullish. Until that confirmation, gold is in a no trade zone.
Conclusion
Bitcoin is still in a heavily bearish posture. While we may see a small reaction rally today or later this week, the bears are still in control until the bulls can create a higher high above $11k. Support remains at $9k while resistance stands at $9.6k.