
Cryptocurrency
Trading Bitcoin: Reaction Rally After Lows
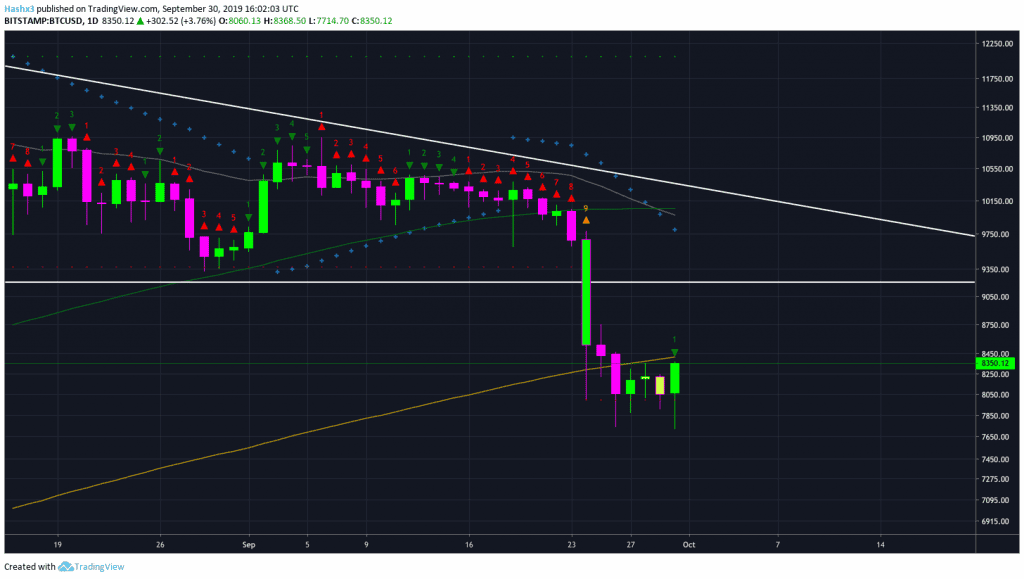
Reaction Rally After Lows After last week’s severe declines, Bitcoin is experiencing a small reaction rally and is currently trading at a price of $8.3k. On the daily chart above, you can see price is still below the 200MA (orange) which, in theory, should act as resistance. Additionally, the Lucid SAR (blue x’s) is still […]
Reaction Rally After Lows
After last week’s severe declines, Bitcoin is experiencing a small reaction rally and is currently trading at a price of $8.3k. On the daily chart above, you can see price is still below the 200MA (orange) which, in theory, should act as resistance. Additionally, the Lucid SAR (blue x’s) is still in a bearish posture acting as resistance. While the current reaction rally is increasing price, until Bitcoin can close above the 200MA and break above resistance at $9k, the bears will likely push price below our previous low of $7.7k.
4 Hour
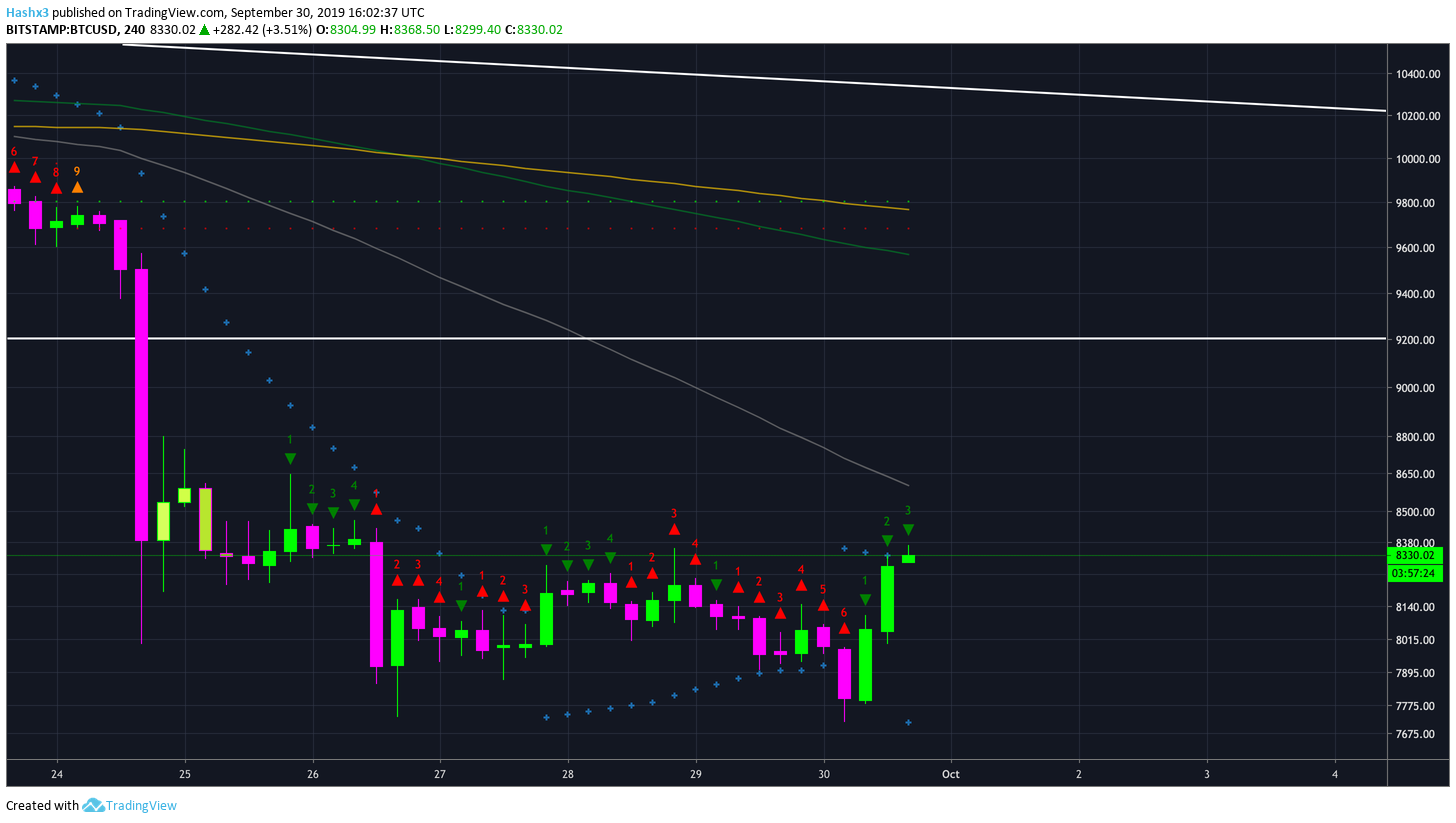
On the 4 hour chart above, you can see price is on a green 3 of 9 candle. In sequential theory, a green 2 closing above a previous green 1 candle is an indication to place a long trade. However, the 50MA (gray) is acting as resistance at $8.5k. Therefore, even if the rally continues, the bulls will likely be rejected by either the 50MA or the 0.382 fibonacci level at $9.2k.
BitMEX Funding and Premium Index & RSI
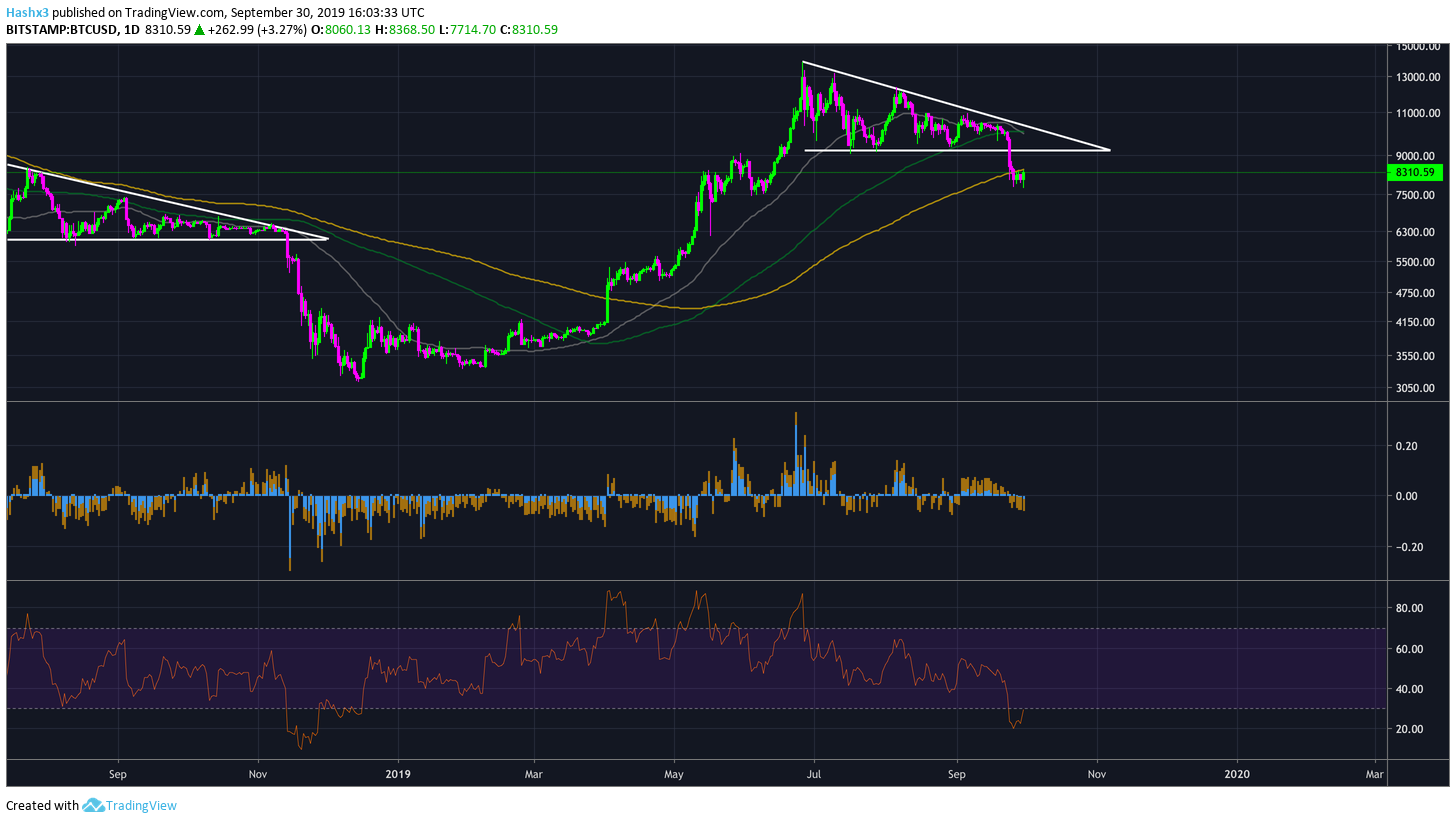
While the majority of indicators we have examined have been bearish, the BitMEX Funding and Premium Index is presenting bullish signals. As you can see from the chart above, the index has been a reliable counter-indicator for the previous 6 months. Currently, the index is telling us price is oversold and an incoming rally will appear in the near future. Additionally, Bitcoin’s RSI is beginning to rebound from profoundly oversold levels. That being said, these oscillators can remain oversold for extended periods of time. Therefore, the reaction rally could continue upward and possibly break key resistance levels. However, there is not enough evidence at our current point to have conviction in a long trade. In order to become a bull, price has to close above the daily 200MA (orange), form support, and then continue to test resistance at $9.2k.
Bitcoin Dominance
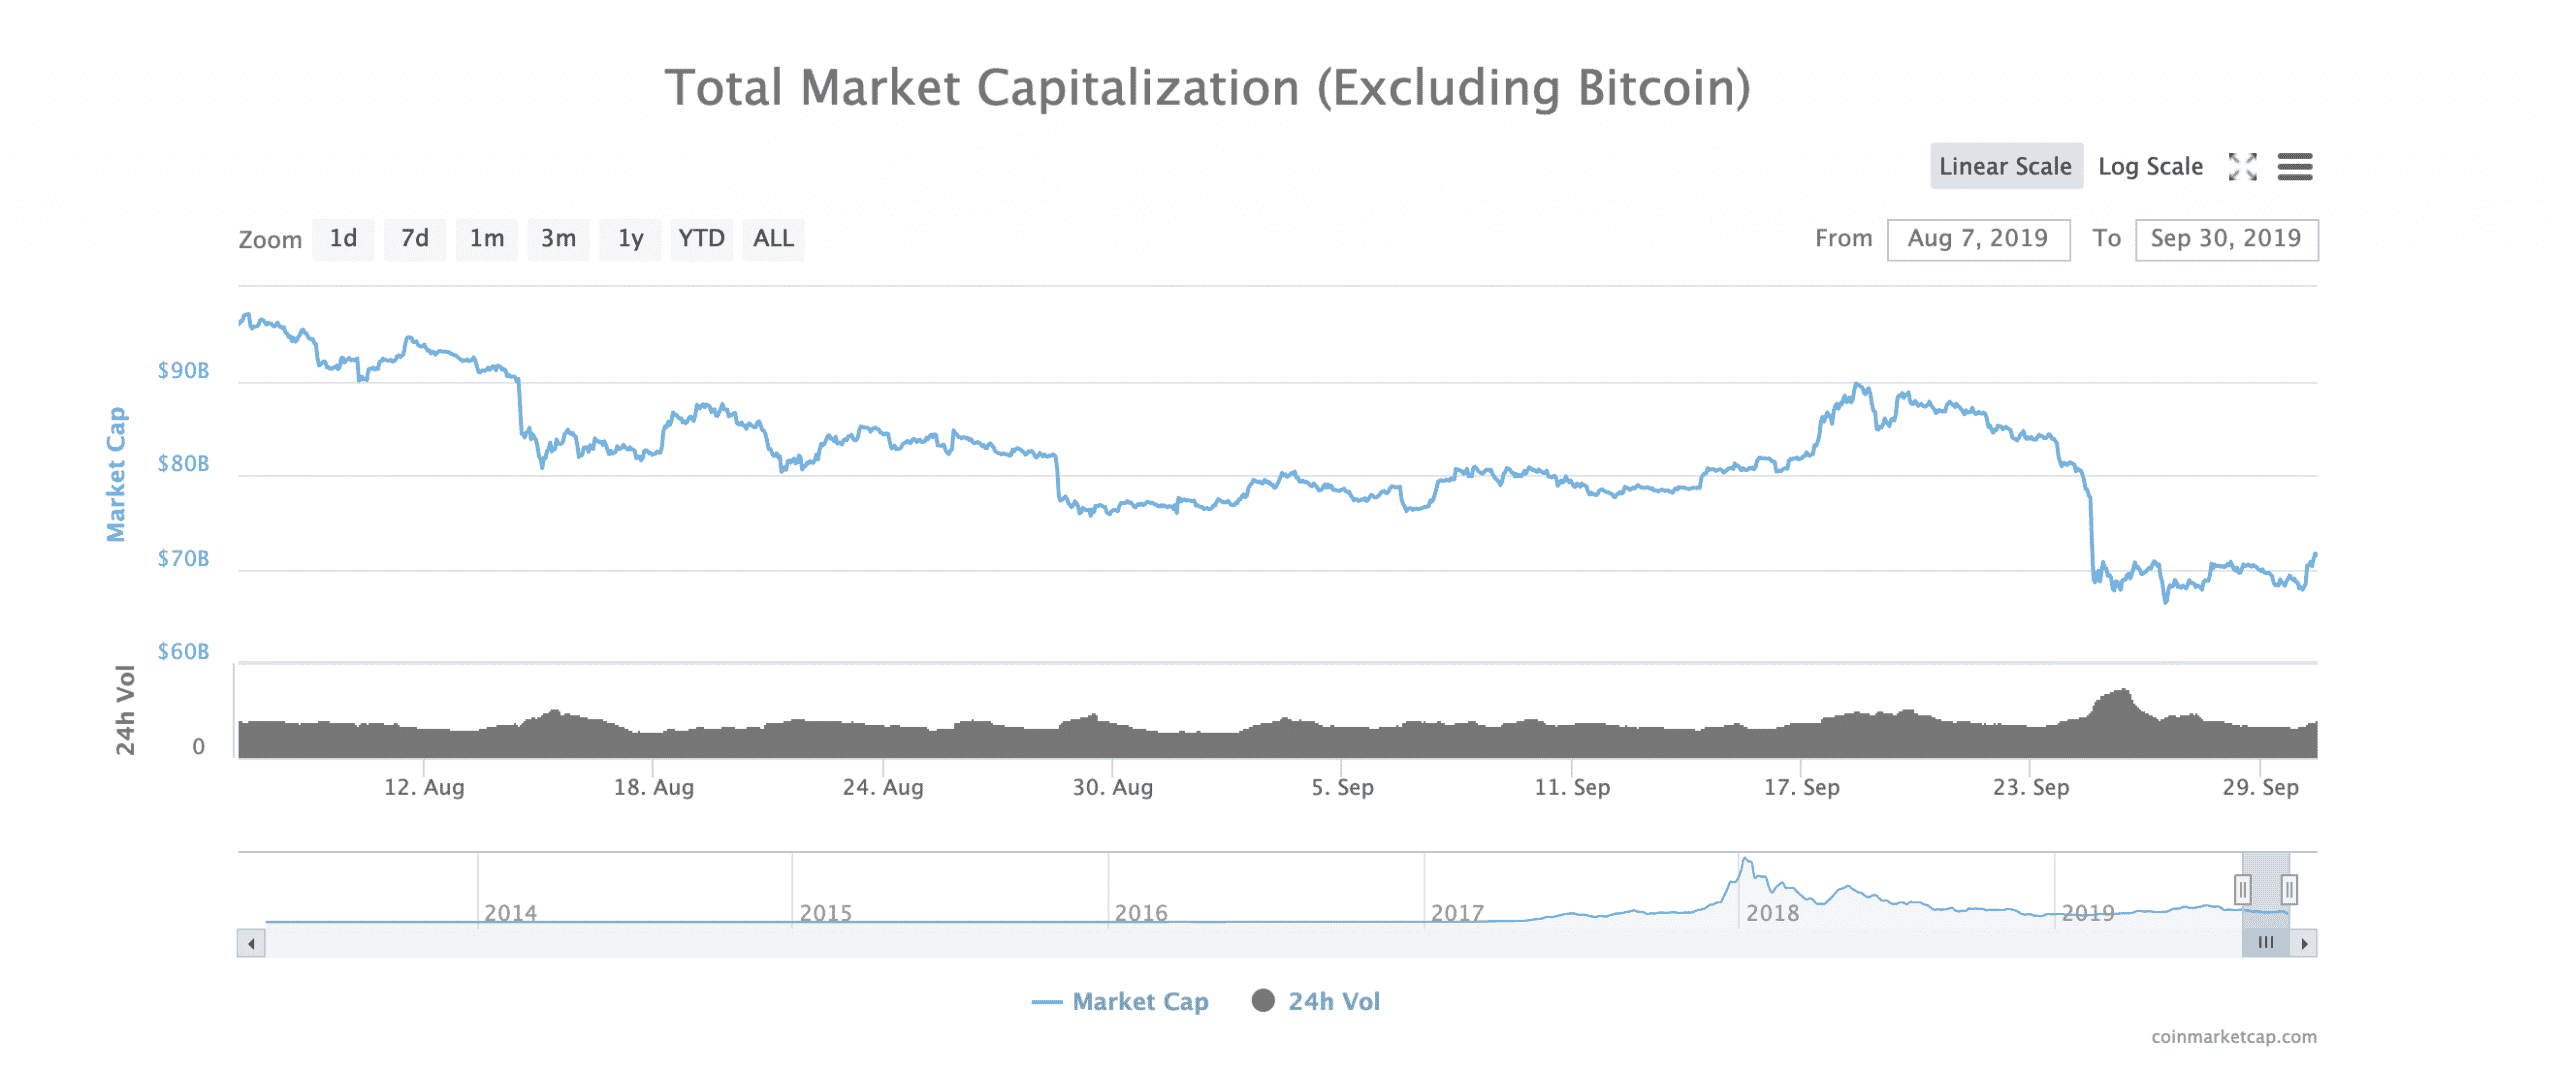
Over the course of the past 6 months, the altcoin market has been decreasing drastically. It will be interesting to monitor whether a future bull market decreases or increases the dominance of the total altcoin market. In the bull market of 2016-2017, the altcoin market cap skyrocketed. However, history may or may not repeat itself in the next cycle.
Conclusion
Price is testing upward resistance levels after last week’s severe decline. Being said, price is still below the daily 200MA (orange) and until price closes above it, the bears remain in control. As of now, today’s uptrend can be characterized as nothing more than a natural reaction rally coming after the midst of a ravage decline. Once the momentum of the reaction rally ceases, Bitcoin will likely test new lows.