
Cryptocurrency
Trading Bitcoin: Reaction Rally For Real?
Reaction Rally For Real? Reaction Rally for real? In yesterday’s article we noted ‘a red 9 is an opportunity to catch a falling knife. However, the current 9 candle has closed below the previous setup trend line (dotted green line) which typically leads to a 1-4 green candle correction. This 1-4 candle correction is usually […]
Reaction Rally For Real?
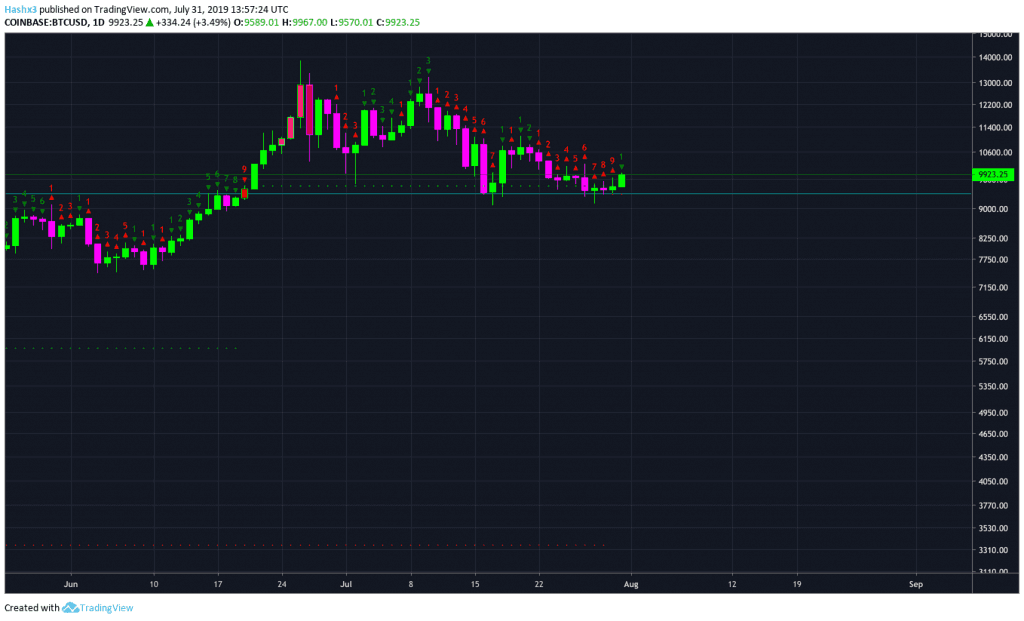
Reaction Rally for real? In yesterday’s article we noted ‘a red 9 is an opportunity to catch a falling knife. However, the current 9 candle has closed below the previous setup trend line (dotted green line) which typically leads to a 1-4 green candle correction. This 1-4 candle correction is usually followed by 9 more days of downward price action.’
Everything that was stated in yesterday’s article still applies to today’s price action. While price has bounced off the daily 9 candle, the bulls still have to create a higher high. If the bulls fail to break above the previous lower high at $11k, then there’s a chance a descending triangle will form with a base at $9k. Remember descending triangles break to the downside 70% of the time.
On the daily chart above, Bitcoin is now on a green 1. If tomorrow we receive a green 2 closing above the previous green 1, that is an indication to place a long trade on a daily timeframe. For a short-term swing trader this may be a reasonable trade. However, if you are looking to buy Bitcoin at the cheapest price possible, you’ll probably have a better opportunity in the future.
4 Hour
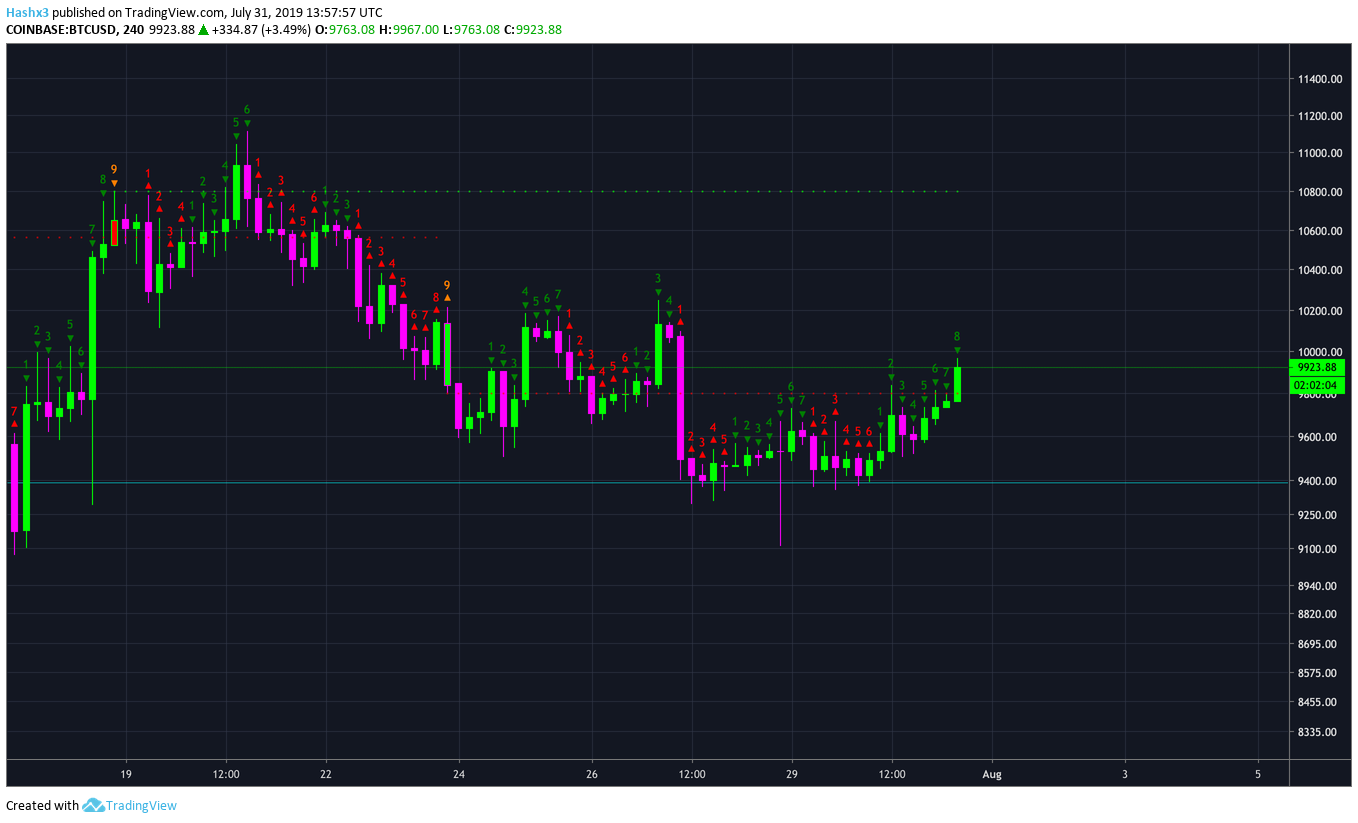
Bitcoin has reached a green 8 on the 4 hour chart above. Within the next 4 hours we may experience a trend reversal if the sequential indicator reaches a green 9. That being said, Bitcoin could just as easily enter a countdown faze and create a green 1 following the 9.
Conclusion
After today’s reaction rally, support remains at $9.5k. The bulls now face a critical resistance at $10k. If they are able to break above it, the next great resistance level is the previous lower high at $11k. Until the bulls can create a higher high by breaking above resistance at $11k, the structure of the trend remains bearish. If Bitcoin’s current reaction rally fails and is rejected around $10.5k, then there is a probability that a descending triangle could form with a base at $9k. This is a deadly pattern any trader must be aware of.