
Cryptocurrency
Trading Bitcoin: Rejected at $8.5k, Now What?
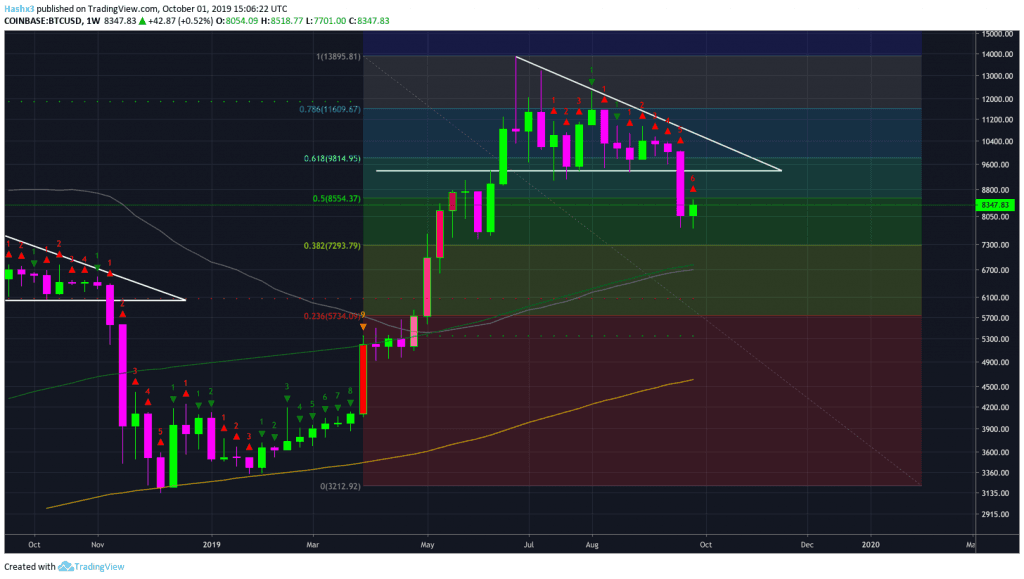
Rejected at $8.5k, Now What? After being rejected at $8.5k, Bitcoin is currently trading at a price of roughly $8.3k. On the weekly chart above, you can see Bitcoin was rejected by the 0.5 Fibonacci level. The sequential indicator is currently on a red 6 of 9 candle. Therefore, sequential theory is calling for 3 […]
Rejected at $8.5k, Now What?
After being rejected at $8.5k, Bitcoin is currently trading at a price of roughly $8.3k. On the weekly chart above, you can see Bitcoin was rejected by the 0.5 Fibonacci level. The sequential indicator is currently on a red 6 of 9 candle. Therefore, sequential theory is calling for 3 more weeks of downside if price does not close above the daily 200MA at $8.4k.
Daily
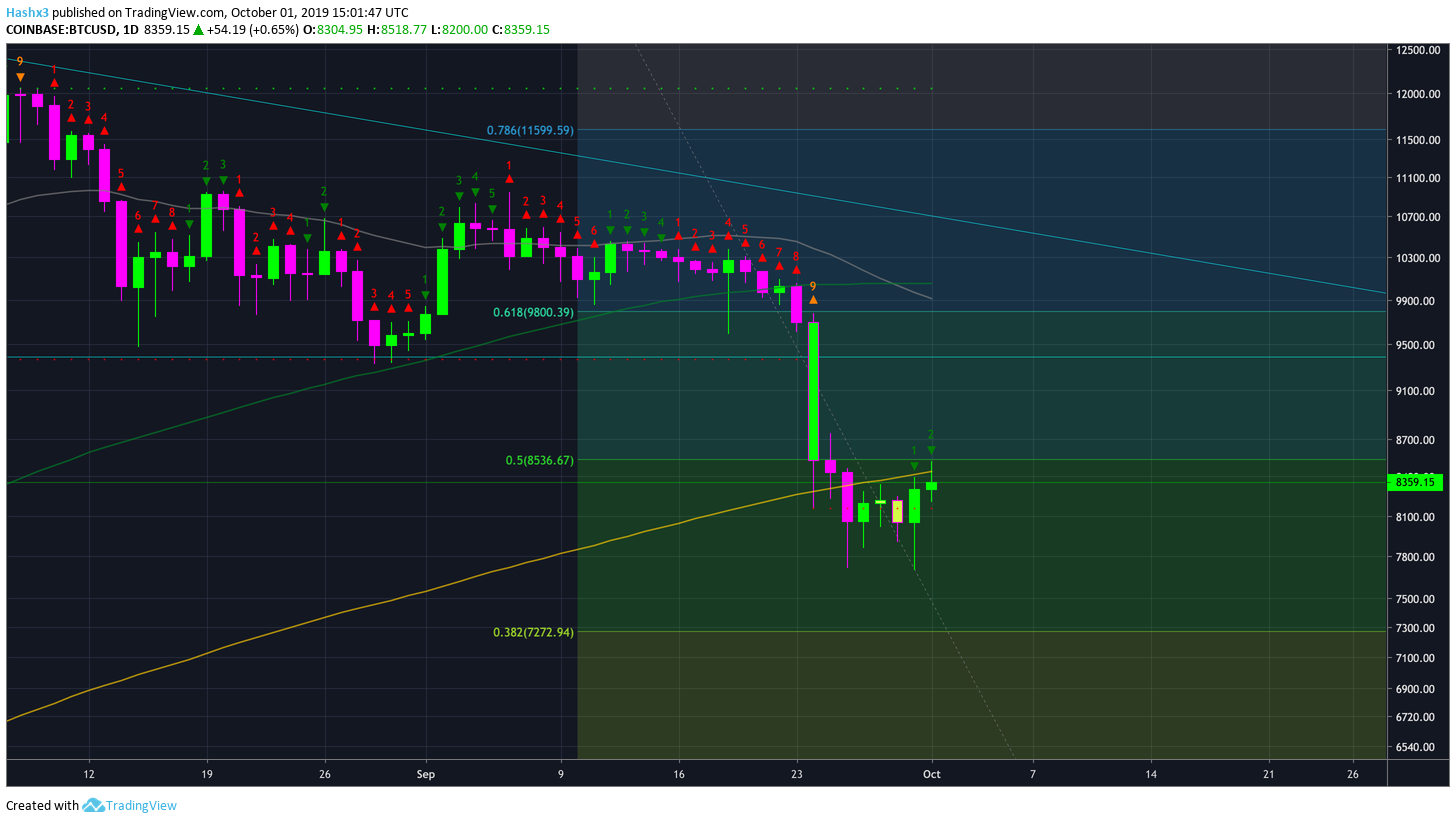
On the daily chart above, price has been rejected by the 200MA (orange). Also, the sequential indicator is currently on a green 2. A green 2 which closes above the previous green 1 is a bullish indication. Nevertheless, we must wait until tomorrow to evaluate whether the next candle trades above or below the moving average. If tomorrow’s candle trades below our current green 2, then there is a high likelihood price will create new lows below $7.7k. If tomorrow’s candle closes above the moving average on a green 3, then there is a high likelihood price will retest the bottom of the descending triangle (at $9.4k) for a probable rejection.
Overall, the question we must ask ourselves: Did price go sufficiently below the moving average, enough to be rejected by the 200MA (orange) on a retest? If not, there’s a good chance price will rebound and retest resistance at $9.4k. Subsequently, the real rejection would then come on a retest of $9.4k.
Conclusion
After being rejected at $8.5k, the bulls and bears are still battling over the daily 200MA. If price closes above it tomorrow, look for a bullish retest to $9.4k for a subsequent rejection. If price closes below the moving average, look for price to create new lows below $7.7k.