
Cryptocurrency
Trading Bitcoin: Relief Incoming After Pullback?
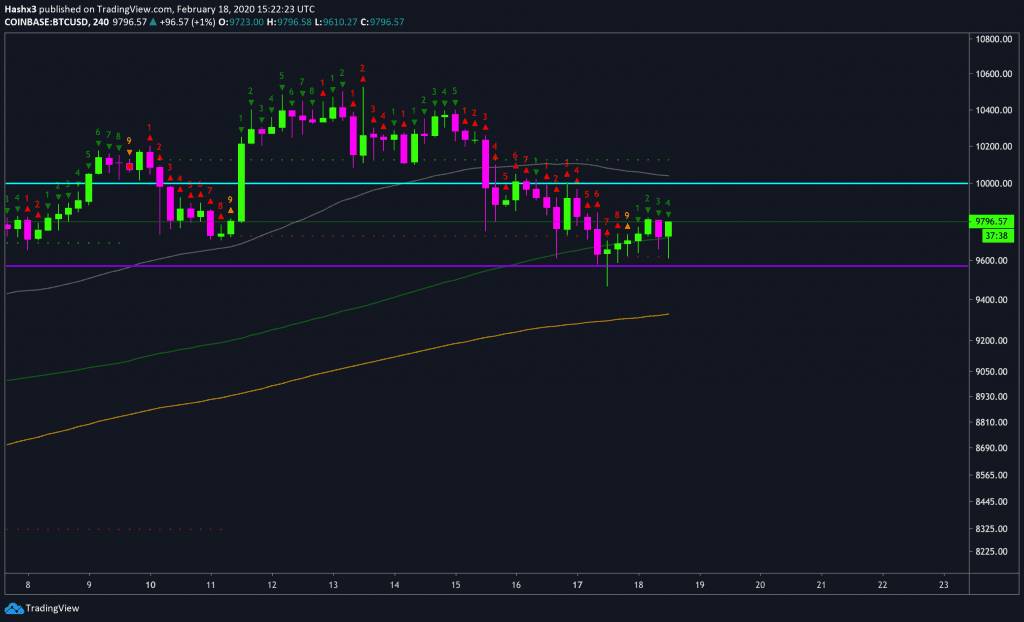
4 Hour After a pullback to $9.6k, Bitcoin has now rallied to $9.8k. On the 4 hour chart above, you can see that the trend reached a red 9 on the sequential indicator. Currently, we are on a green 4 of 9 candle. If you were trading based on the 4 hour chart, the sequential […]
4 Hour
After a pullback to $9.6k, Bitcoin has now rallied to $9.8k. On the 4 hour chart above, you can see that the trend reached a red 9 on the sequential indicator. Currently, we are on a green 4 of 9 candle. If you were trading based on the 4 hour chart, the sequential indicator signaled a long trade during our previous green 2. Furthermore, the 128MA (green) is still serving as strong support for the trend. As long as price remains above this moving average, the bulls remain in control.
Daily
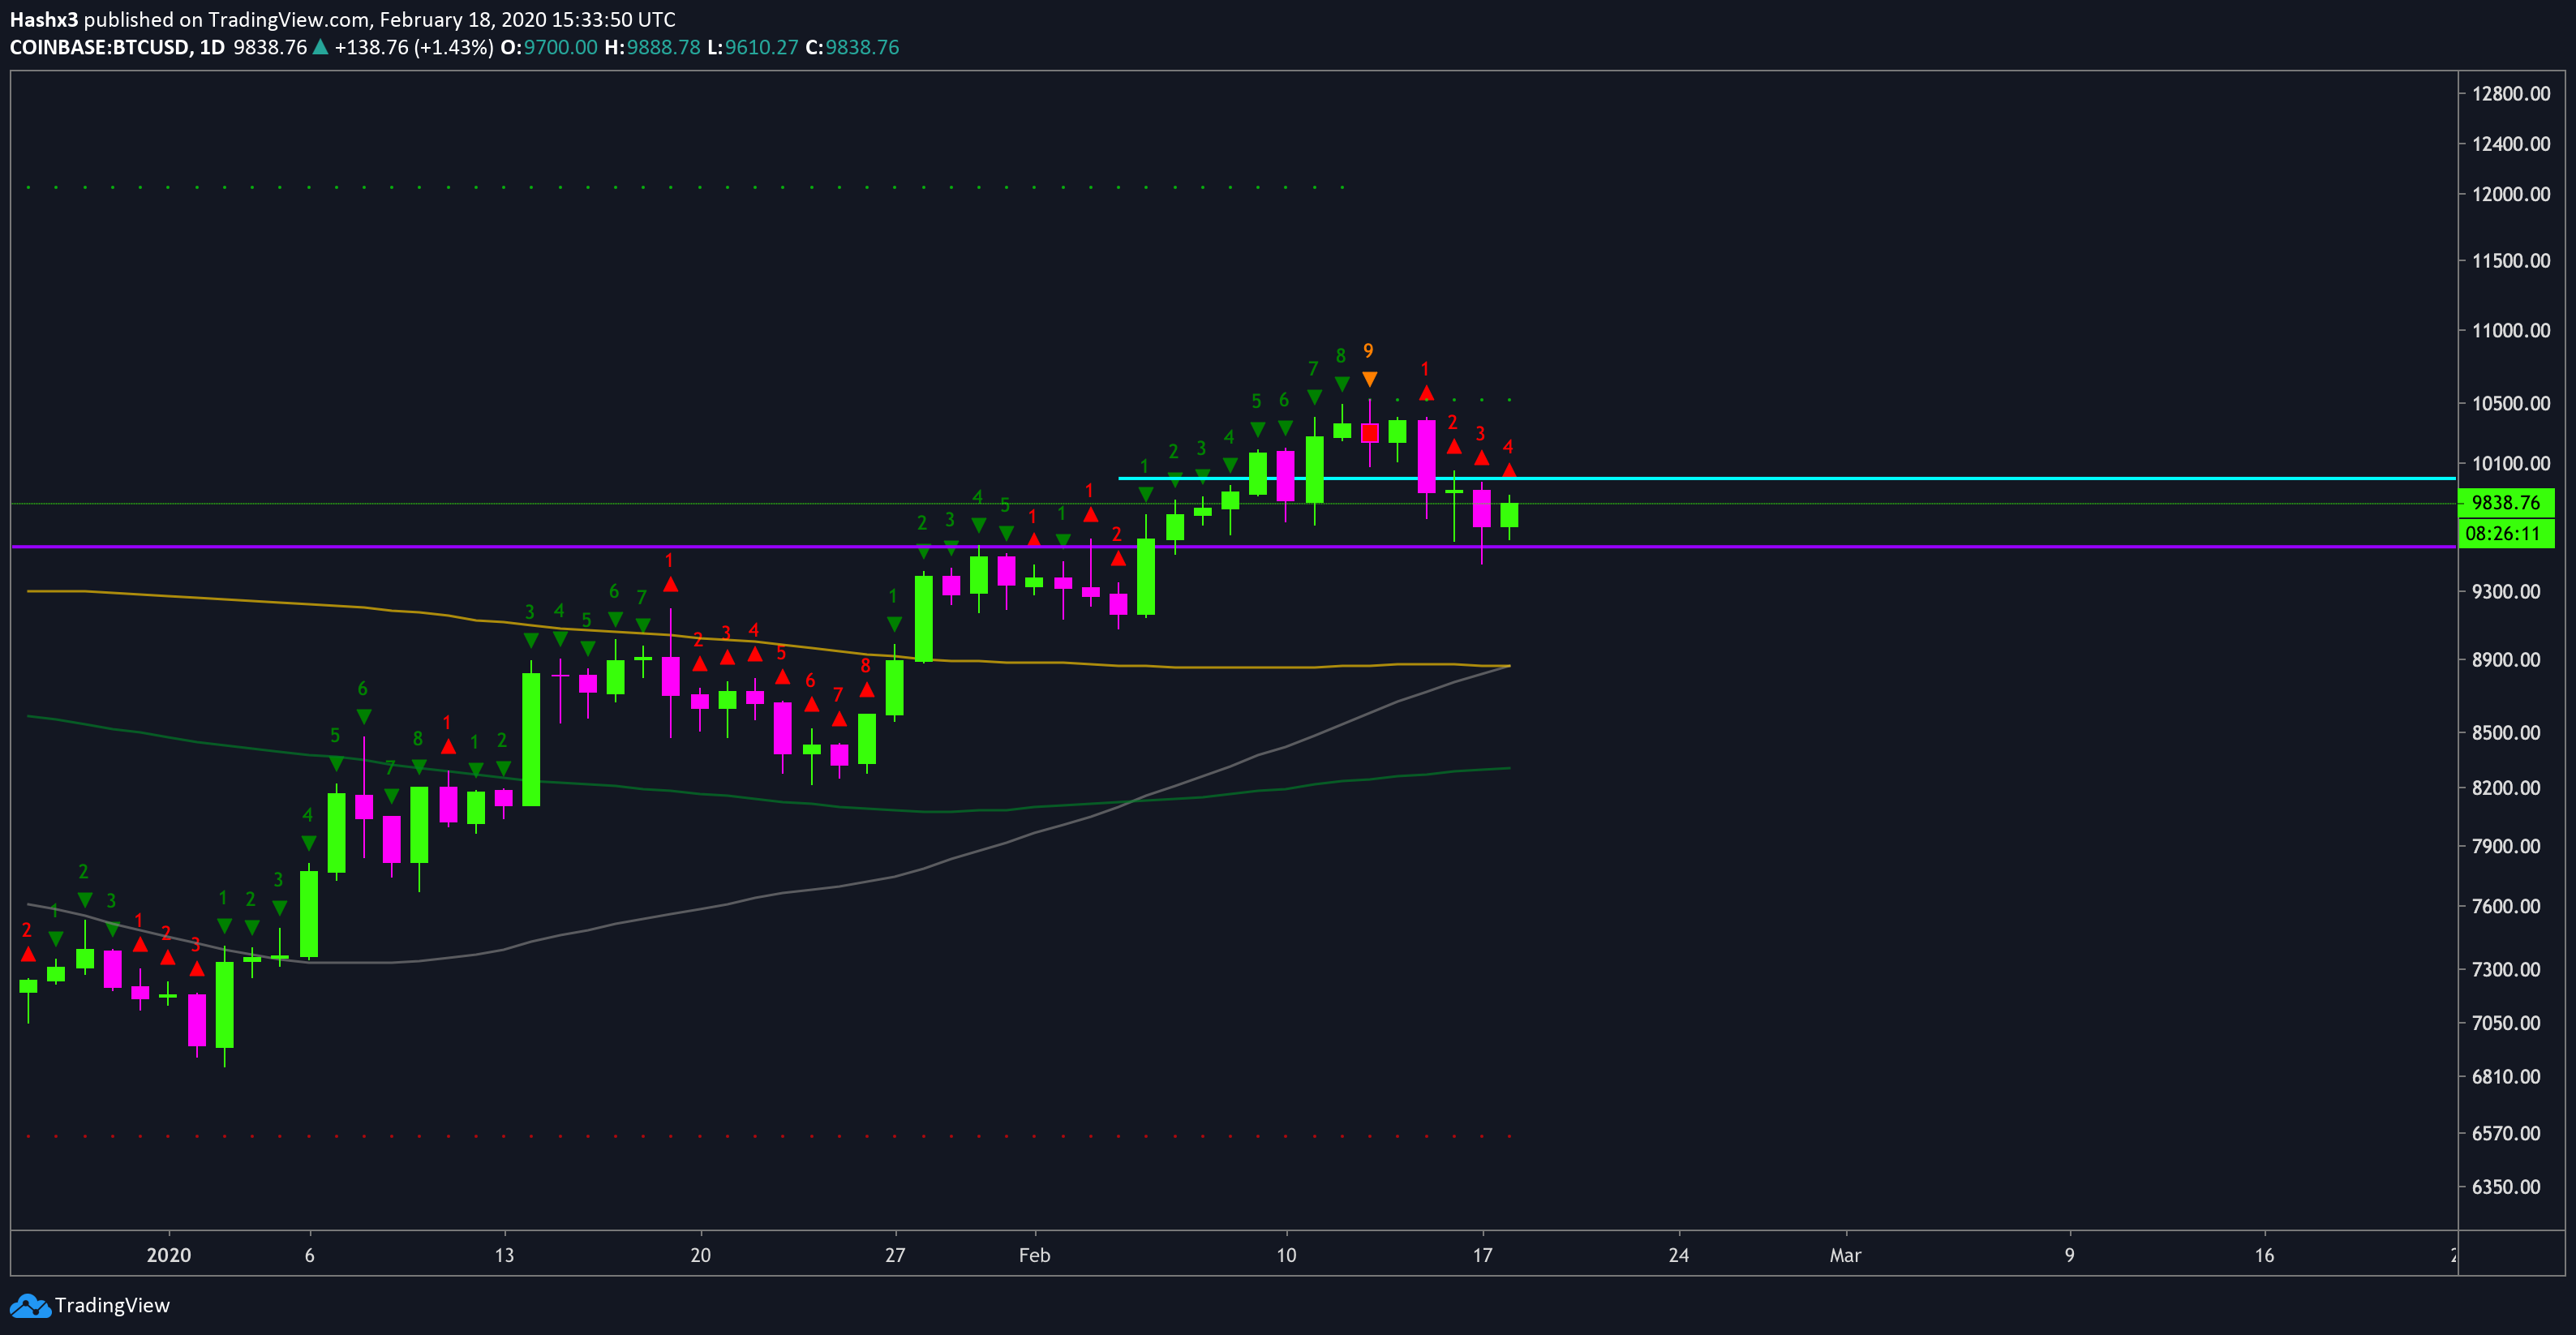
On the daily chart above, the sequential indicator has reached a red 4. After the sequential indicator reaches a 9, sometimes it will enter a 1-4 candle correction of the opposite color. Since we are on a red 4 following a green 9, our 1-4 candle correction phase may be nearing an end. Furthermore, bullish relief may be in site. This is compounded by the fact the bulls are already rallying on the 4 hour. Also, the 50MA (grey) just crossed over the 200MA (orange) to form a golden cross. This technical indicator is a reflection of past bullish price action. Still the trend needs a firm break above the $10k resistance level for the bulls to regain momentum.
Conclusion
As of now, the recent price decline seems as if it was nothing more than a healthy pullback. In fact, the recent decline may be an opportunity to buy the dip. However, critical support remains at $9.5k.
BTCUSD Chart by TradingView