
Cryptocurrency
Trading Bitcoin: Still in the Triangle
Still in the Triangle Bitcoin remains in the descending triangle as the bulls and bears fight in a stalemate. After being rejected last week at $10.9k, Bitcoin has declined to $10.1k. Currently, the sequential indicator is telling us Bitcoin will be neutral-bearish from a daily perspective. It is important to note Bitcoin was rejected by […]

Still in the Triangle
Bitcoin remains in the descending triangle as the bulls and bears fight in a stalemate. After being rejected last week at $10.9k, Bitcoin has declined to $10.1k. Currently, the sequential indicator is telling us Bitcoin will be neutral-bearish from a daily perspective. It is important to note Bitcoin was rejected by the 50MA (gray) and is now battling resistance at $10.4k. Conversely, Bitcoin has been strongly supported by the 128MA (green) over a significant period of time. If Bitcoin remains flat for the next month, it will have a better chance of breaking out and negating the descending triangle. However, if the 128MA (green) is purged, the bears will likely gain significant momentum.
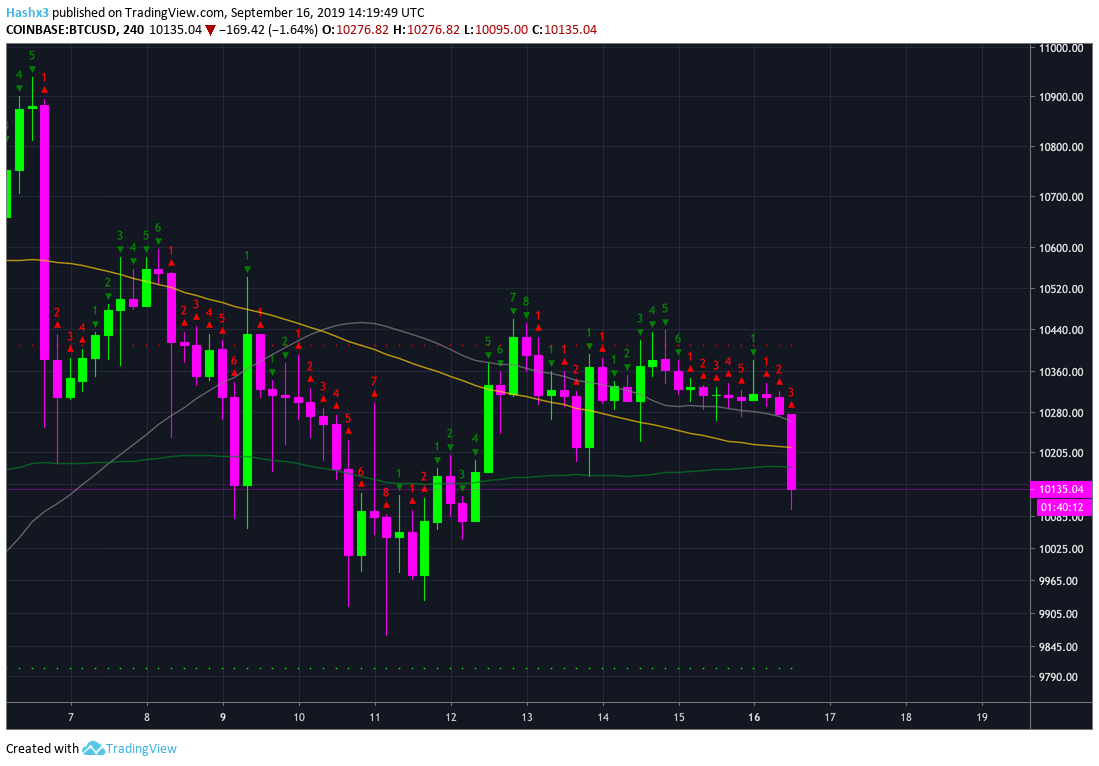
4 Hour
On the 4 hour chart above, you can see that Bitcoin has recently broken below all three moving averages. The sequential setup trend line is providing support at $9.8k. Note that sequential setup trend lines have been very accurate when predicting support and resistance levels through out the previous year.
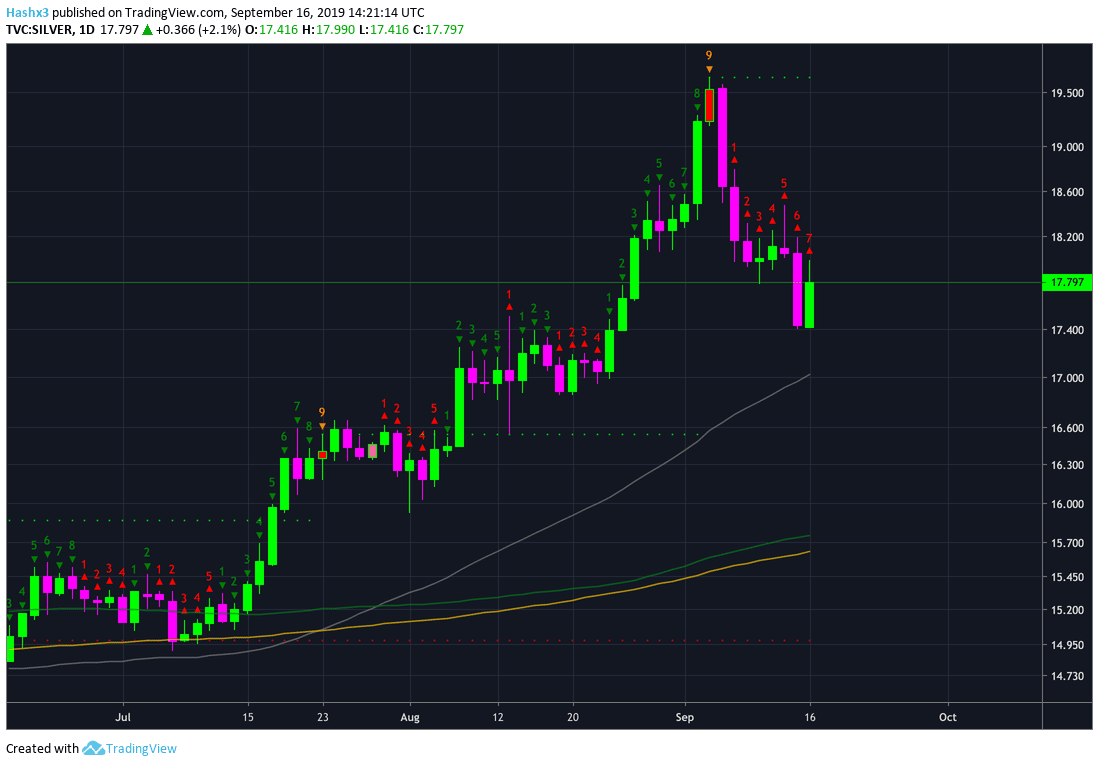
Silver Daily
On Silver’s daily chart above, you can see price topped on a sequential 9 perfectly. Sequential theory should not be the only indicator you use as a trader. There are many other indicators which should used which are based on price action. However, it is essential to have an indicator which measures momentum through time. The TD sequential indicator was designed to do just that.
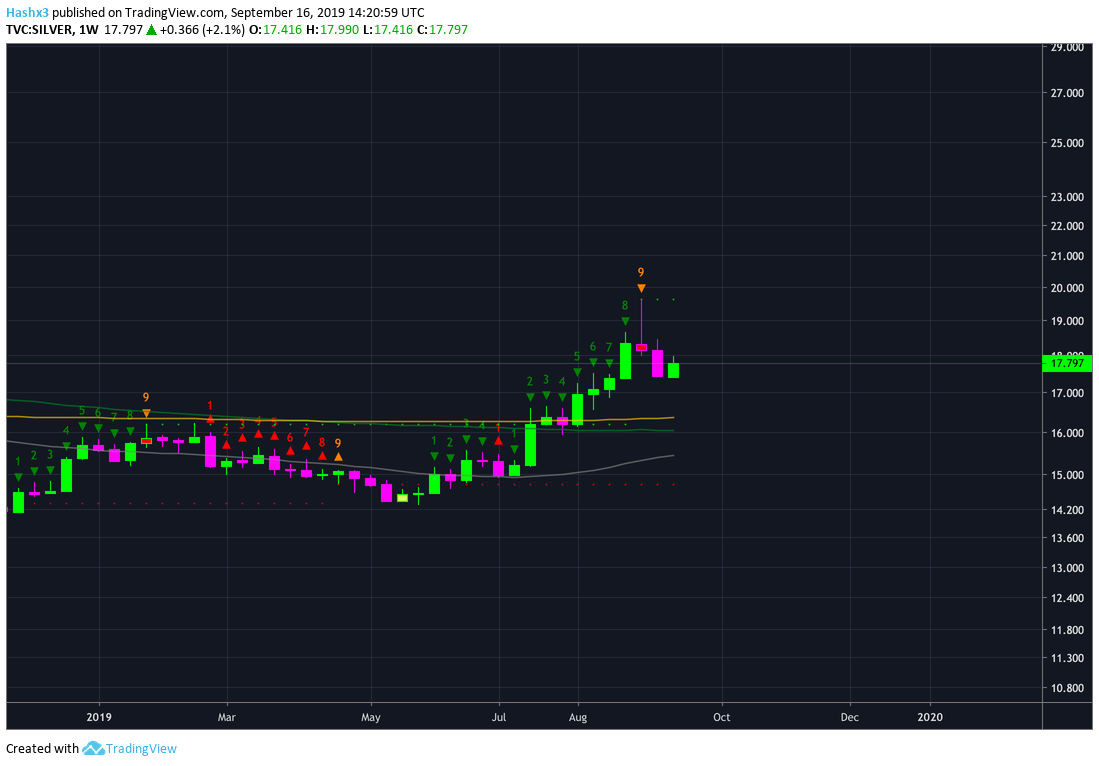
Silver Weekly
On Silver’s weekly chart above, you can see the sequential indicator called the top of Silver’s weekly chart as well as its daily chart. When multiple timeframes reach a 9 on the sequential indicator, it is a strong indication of an incoming trend reversal.
Conclusion
As the title of this article suggests, Bitcoin is still in the descending triangle. Until Bitcoin can negate the triangle by breaking above $11k, the overall posture of the trend is bearish. More importantly, it is wise to be aware of the date in which the triangle ends. Within our current setup, Bitcoin will likely break the descending triangle during the first week of October. At Market Rebellion, we are watching October 5th diligently.
Disclaimer: The author of the article hodls Bitcoin.