
Cryptocurrency
Trading Bitcoin: Stuck at $10.2k
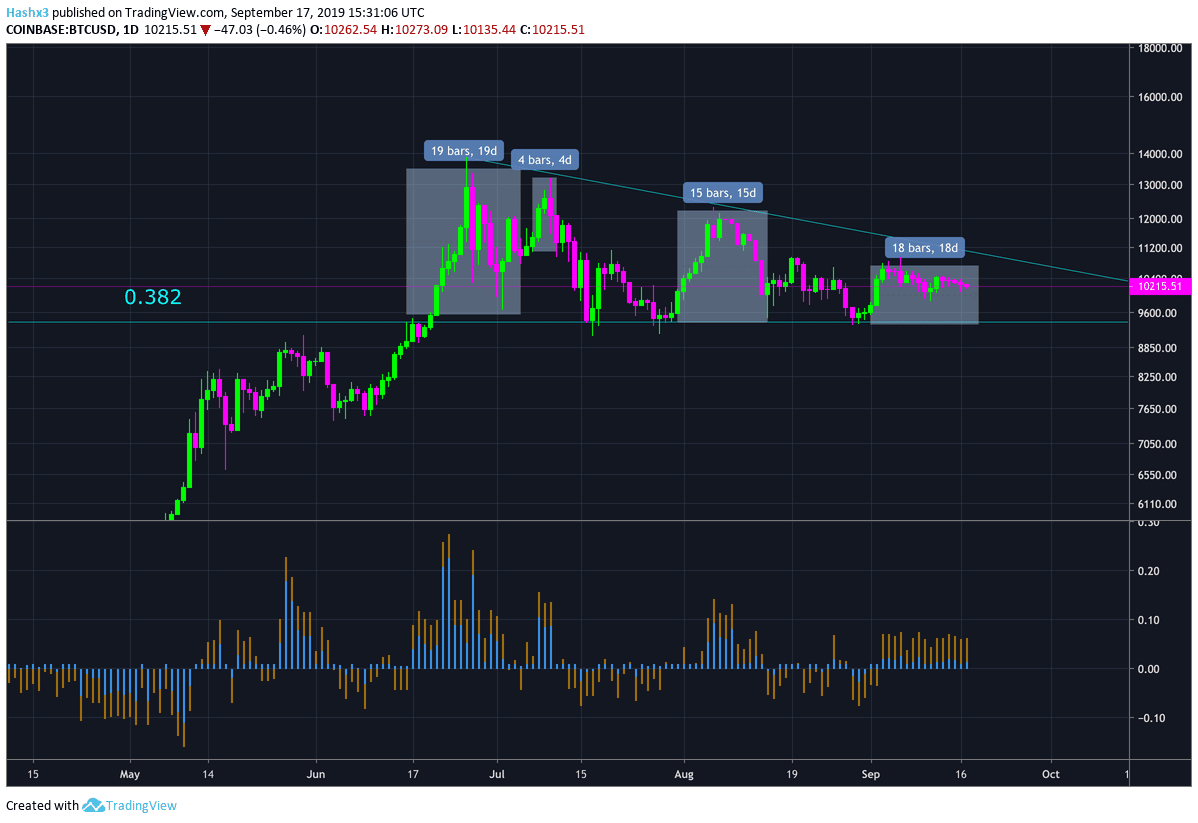
Stuck at $10.2k It’s been a slow week in the cryptocurrency market as price remains stuck at $10.2k. On the daily chart above, the sequential indicator is on a red 2 of 9 candle. In sequential theory, a red 2 closing below the previous red 1 candle is an indication to enter a short trade. […]

Stuck at $10.2k
It’s been a slow week in the cryptocurrency market as price remains stuck at $10.2k. On the daily chart above, the sequential indicator is on a red 2 of 9 candle. In sequential theory, a red 2 closing below the previous red 1 candle is an indication to enter a short trade. However, at Market Rebellion, we like to wait for additional confirmations before we place a trade. For example, the Lucid SAR (blue x’s) is currently acting as bullish support around $9.8k. For a short trade, we would need both the sequential indicator and Lucid SAR to provide bearish signals. Currently, only the sequential indicator is bearish. Also, the 128MA (green) has been a critical support level which is also aligned with the Lucid SAR at $9.8k. While price action is looking bearish, Bitcoin has strong support at $9.8k. If a decline should occur, our first major support level will likely be the 128MA at $9.8k.
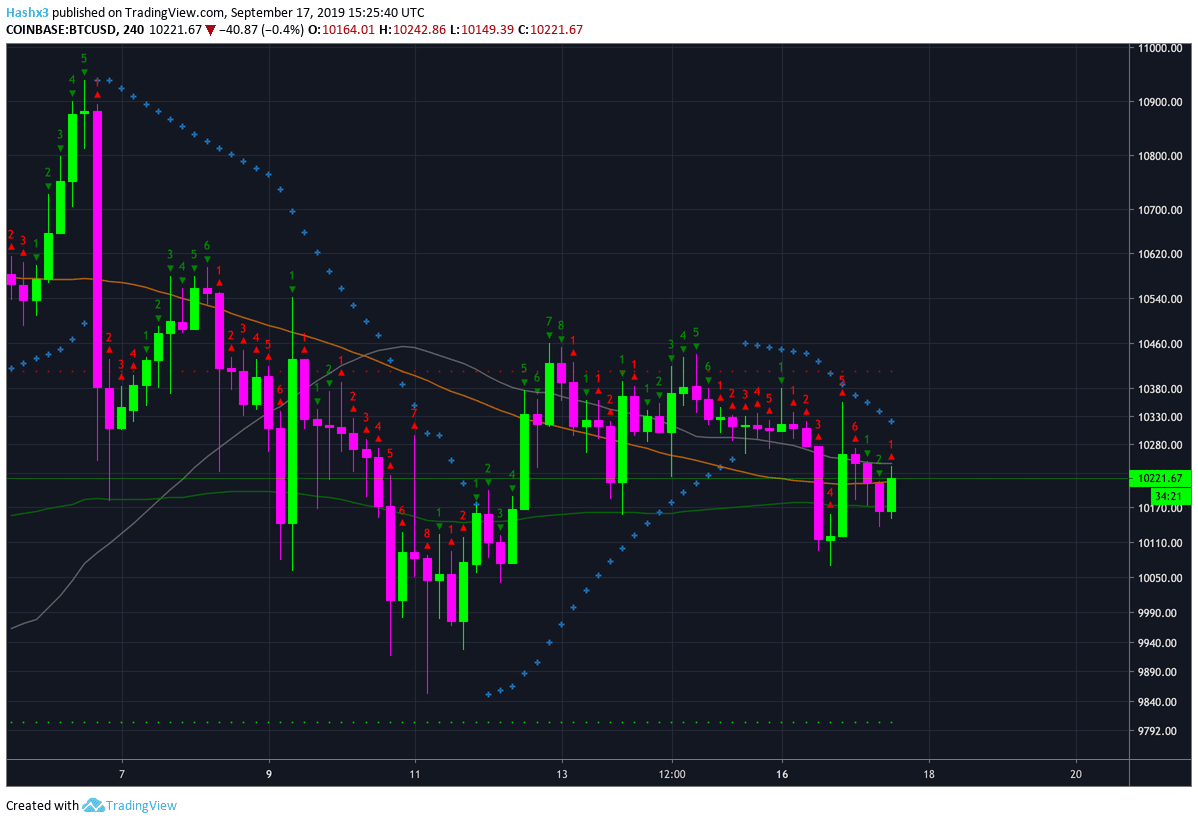
4 Hour
The 4 hour chart is slightly more bearish than Bitcoin’s daily chart. On the 4 hour chart above, the Lucid SAR is acting as resistance at $10.3k. Also, price is still facing resistance from the 50MA. Overall, the 4 hour chart is currently neutral-bearish.
BitMEX Funding and Premium Index
The BitMEX Funding and Premium Index has been a reliable counter-indicator for the previous year. In our current market circumstances, the funding and premium index has been overextended for the past three weeks. Therefore, an eventual decline is becoming more probable.
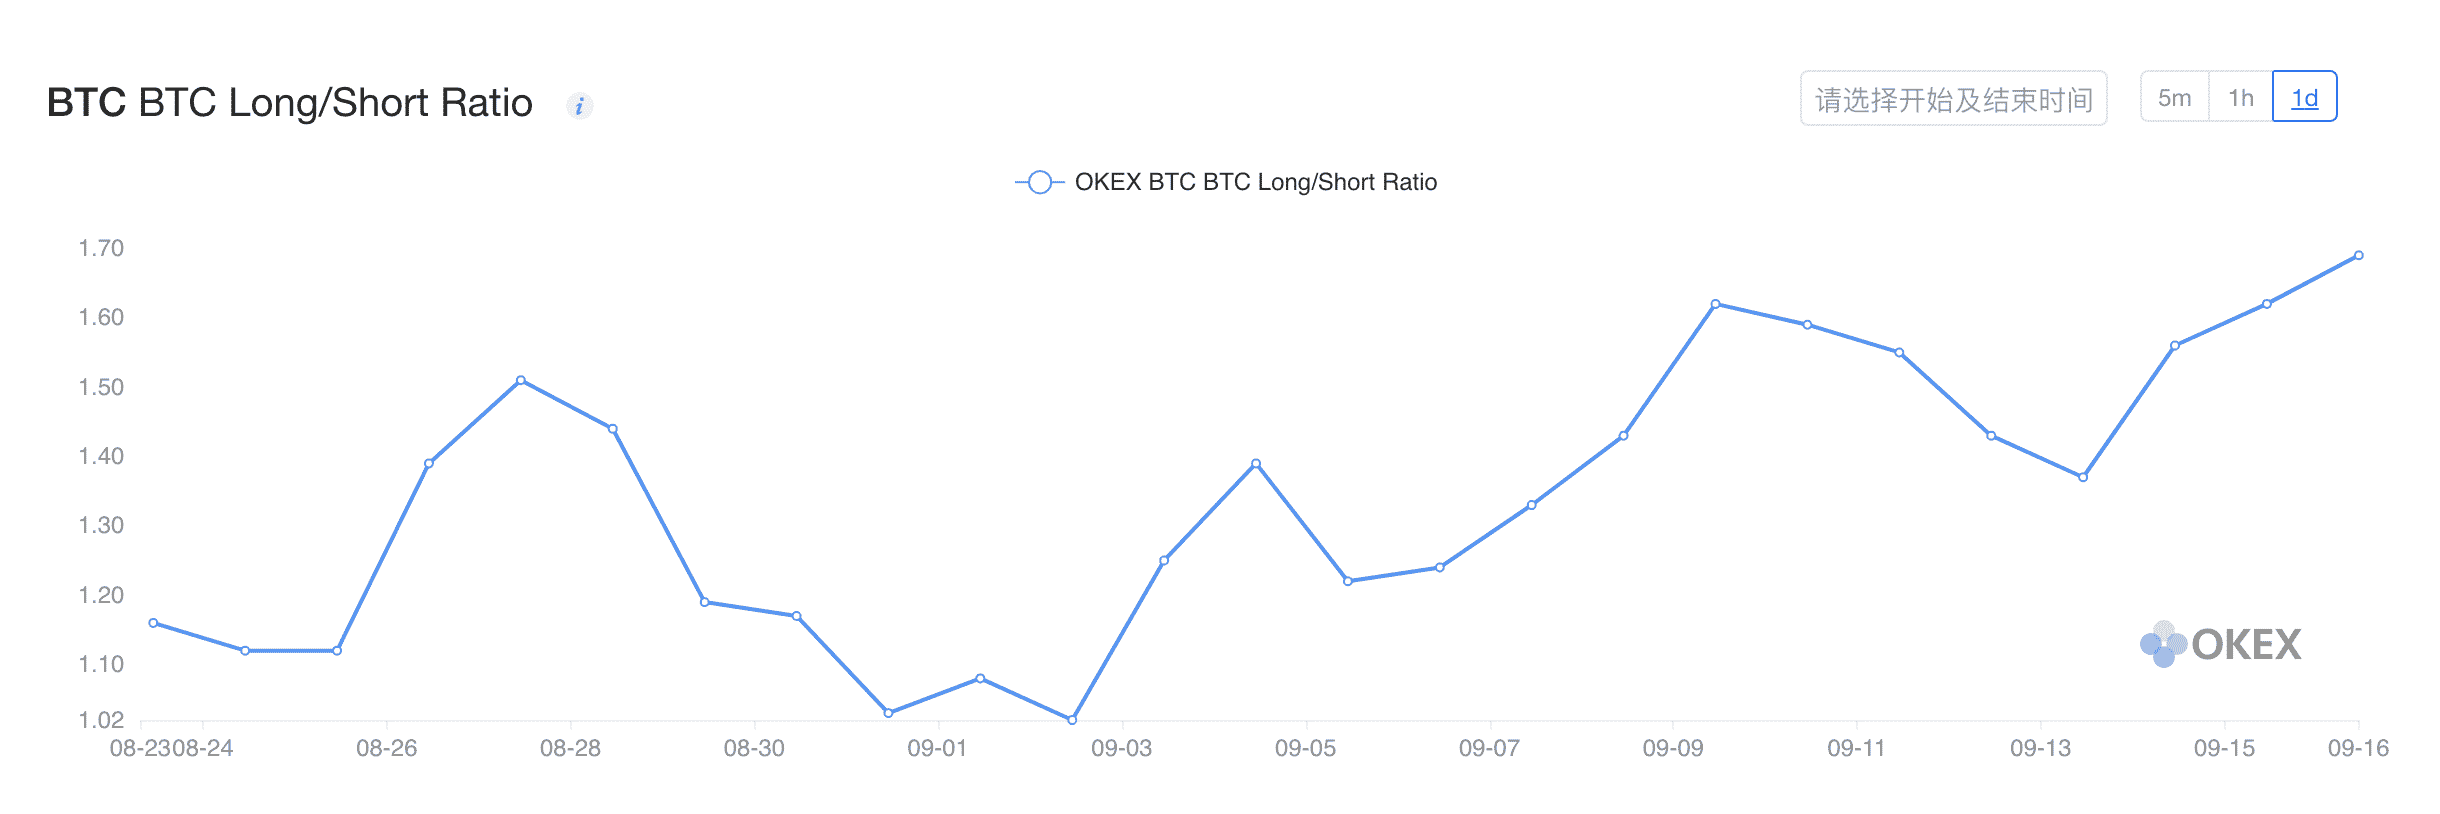
OKEX Long/Short Ratio
At Market Rebellion, we can’t ignore the substantial eastern volume coming from exchanges such as OKEX and Huobi. Above is a chart recently published by the South Korean exchange OKEX. The chart measures the number of users who are long divided by the number of users who are short. From this data, we can see this number has been climbing higher in recent days, which tells us most retail participants are long and a few larger players are short. Furthermore, it is wise to go against the retail majority in this situation and view the market with an overall bearish bias.
Conclusion
As of now, we remain stuck at $10.2k. However, we have an inclination to believe the market will soon decline to the $9.8k support level. While price may continue to hover above $10k for the next week or two, the overall structure of the trend is presenting strong bearish indicators.
Disclaimer: The author of the article hodls Bitcoin.