
Cryptocurrency
Trading Bitcoin: Stuck at $7.3k
On the daily chart above, Bitcoin is in a bearish posture and is on a sequential red 3. According to the sequential indicator, price action is telling you to short. Downward Parallel Channel Additionally, the longer it takes Bitcoin to breakout out of the parallel channel, the lower price will likely go leading up to […]

On the daily chart above, Bitcoin is in a bearish posture and is on a sequential red 3. According to the sequential indicator, price action is telling you to short.
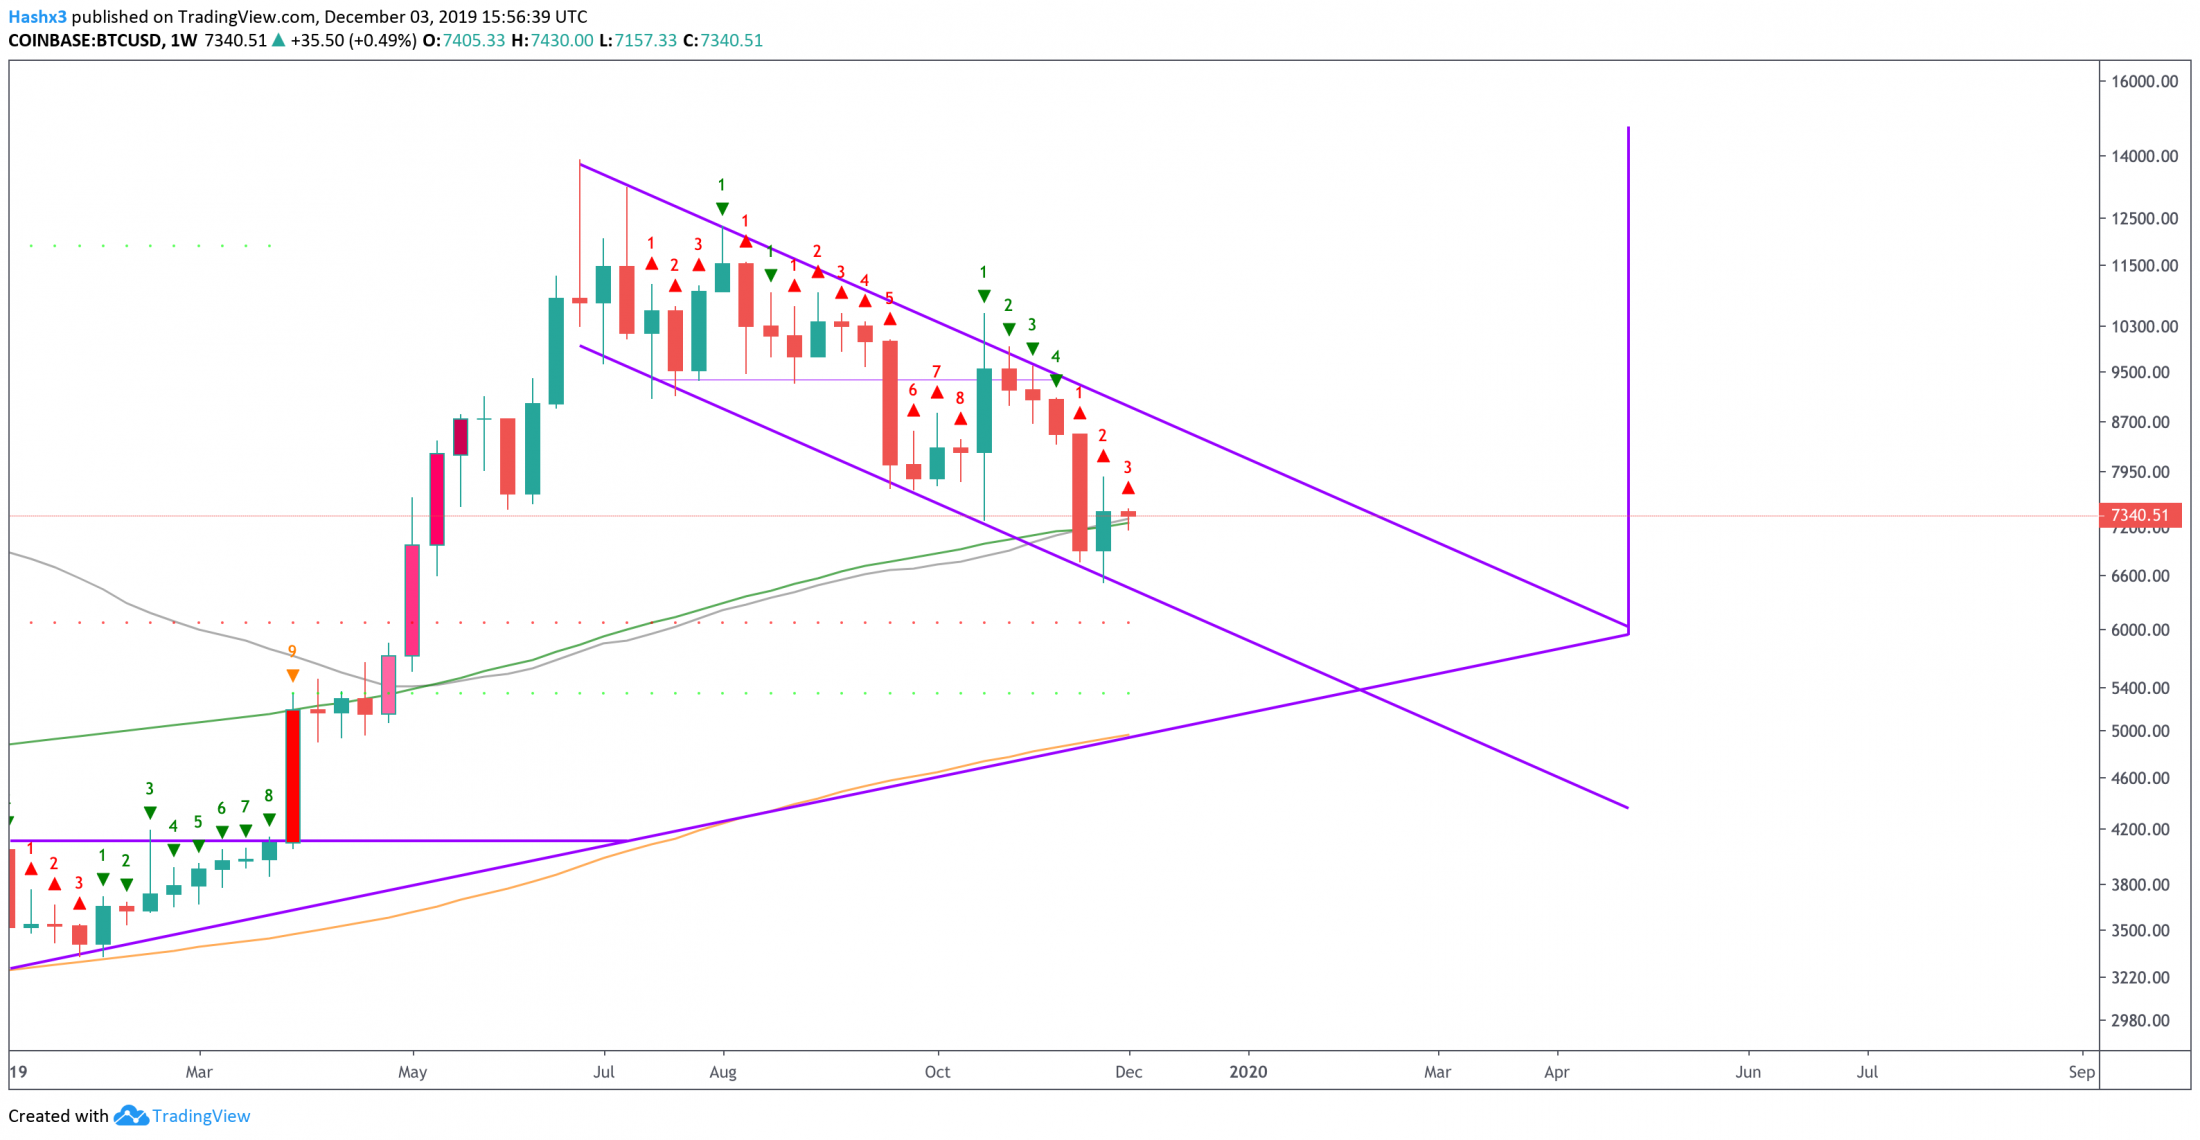
Downward Parallel Channel
Additionally, the longer it takes Bitcoin to breakout out of the parallel channel, the lower price will likely go leading up to the halving. Once Bitcoin can breakout of the parallel channel, bullish price action will resume.
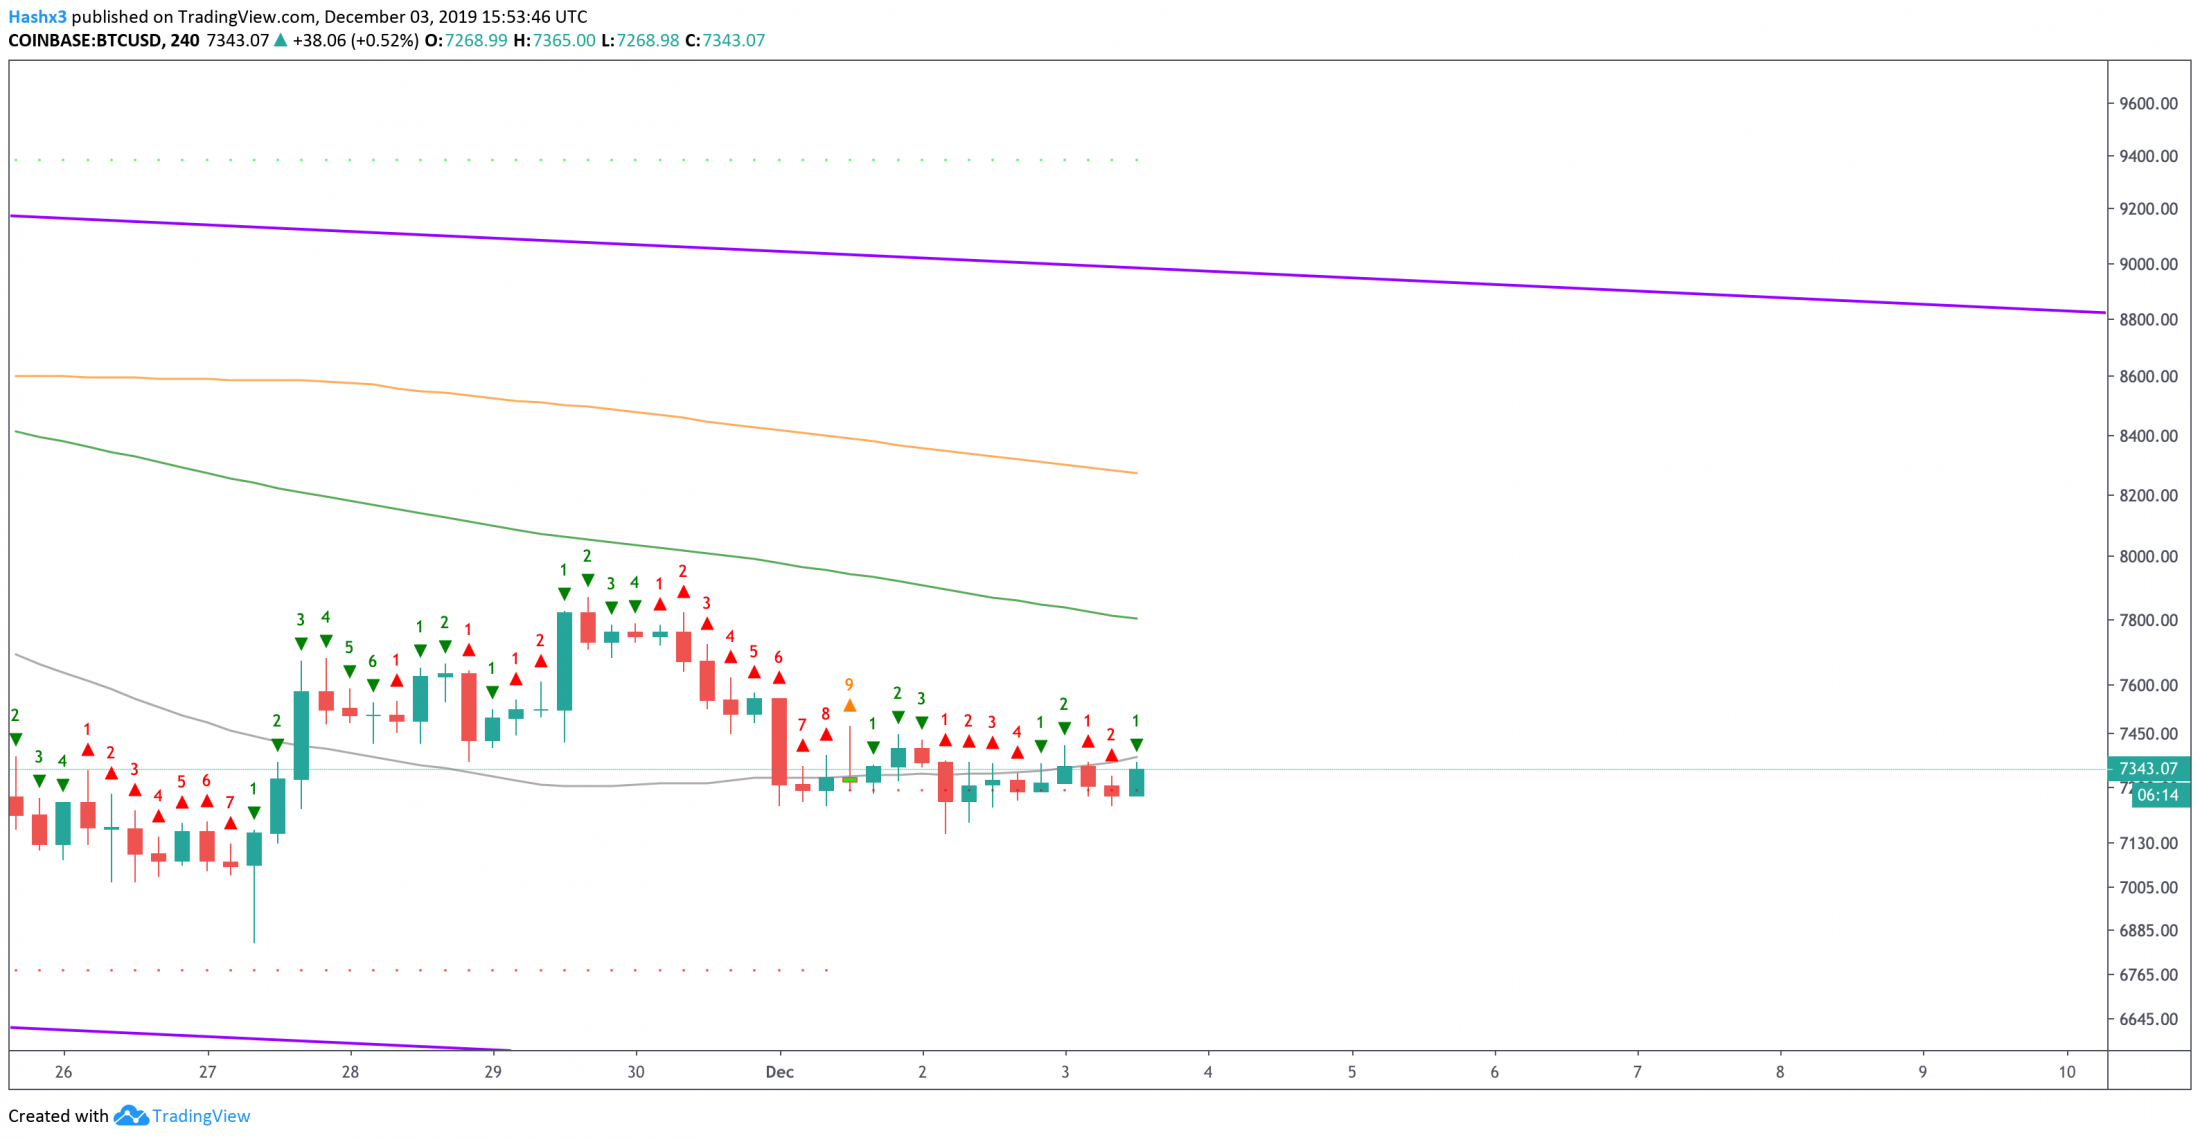
4 Hour
Nothing too new on the 4 hour chart above. Bitcoin has flipped to a green 1 and is still trading below the 50MA (grey). The 50MA will be a critical battlefield between the bulls and the bears.
Conclusion
The longer it takes Bitcoin to breakout of the downward sloping channel, the lower price will go leading up to the halving. Current support remains at $7.3k while critical resistance stands at $7.7k and $8k.
Disclaimer: The author of the article hodls Bitcoin.