
Cryptocurrency
Trading Bitcoin: Support Broken at $8.5k, Not Out of the Woods Yet
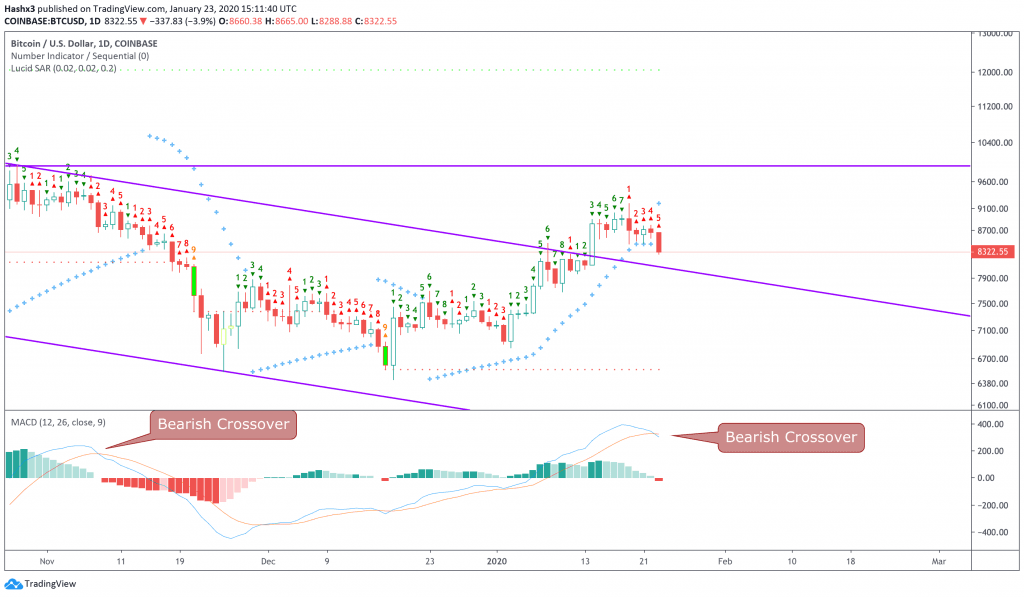
Daily Bitcoin is down 3% today and is currently trading at a price of roughly $8.3k. The sequential indicator is on a red 5 on the daily chart and is calling for continued downward price action. Additionally, the Lucid SAR (blue x’s) have now moved above price and are acting as bearish resistance. Above all, […]
Daily
Bitcoin is down 3% today and is currently trading at a price of roughly $8.3k. The sequential indicator is on a red 5 on the daily chart and is calling for continued downward price action. Additionally, the Lucid SAR (blue x’s) have now moved above price and are acting as bearish resistance. Above all, the most important indicator on the chart above may be the MACD. Currently, we are in the middle of a bearish crossover on the MACD. Considering historic price action, this is a very bad signal for the bulls and the chart above makes it obvious how close we are to another sell off.
BTC/USD Shorts
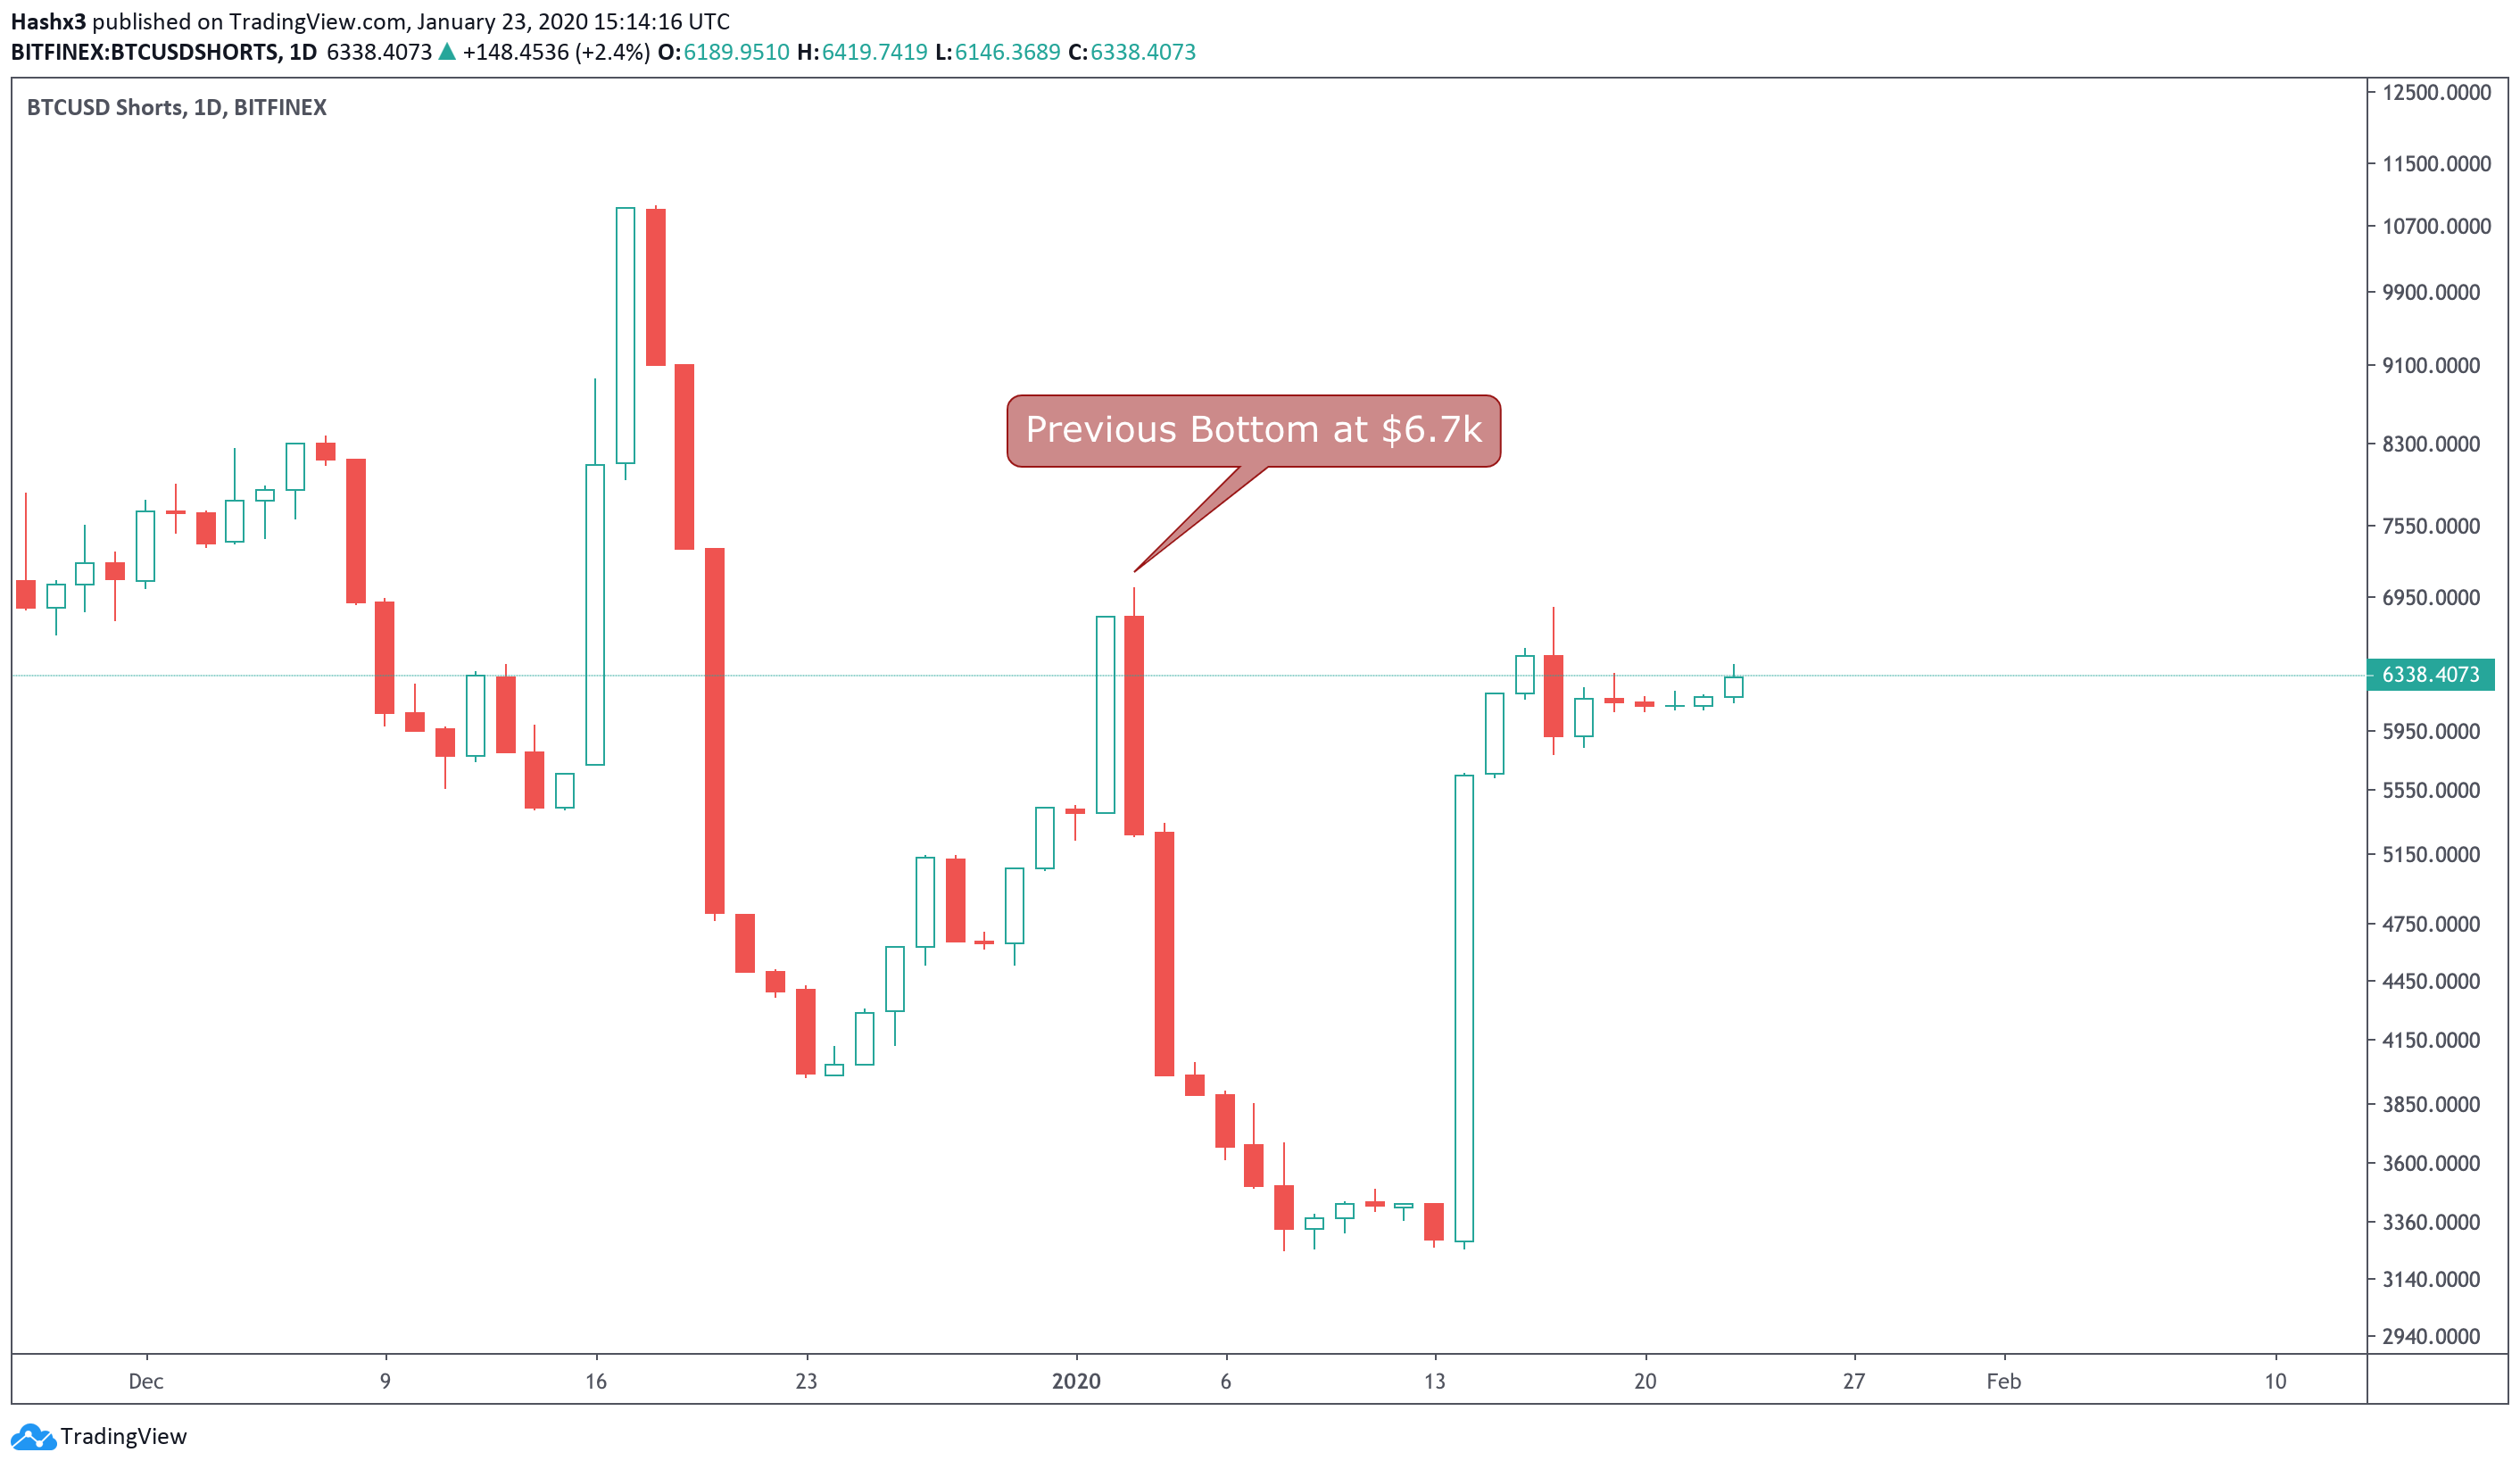
From the chart above, you can see our recent bearish price action has led to an increase in the amount of short trades opened. From our perspective, this is a bullish signal because the last time shorts reached this level, we bottomed at $6.7k. At our current point, it only takes one bull whale to spike price into a short squeeze. Above all, I wouldn’t short Bitcoin at $8k, 5 months before the block halving. Even if the short term indicators are telling you to short, the risk-reward profile is asinine.
Crypto Birb Chart
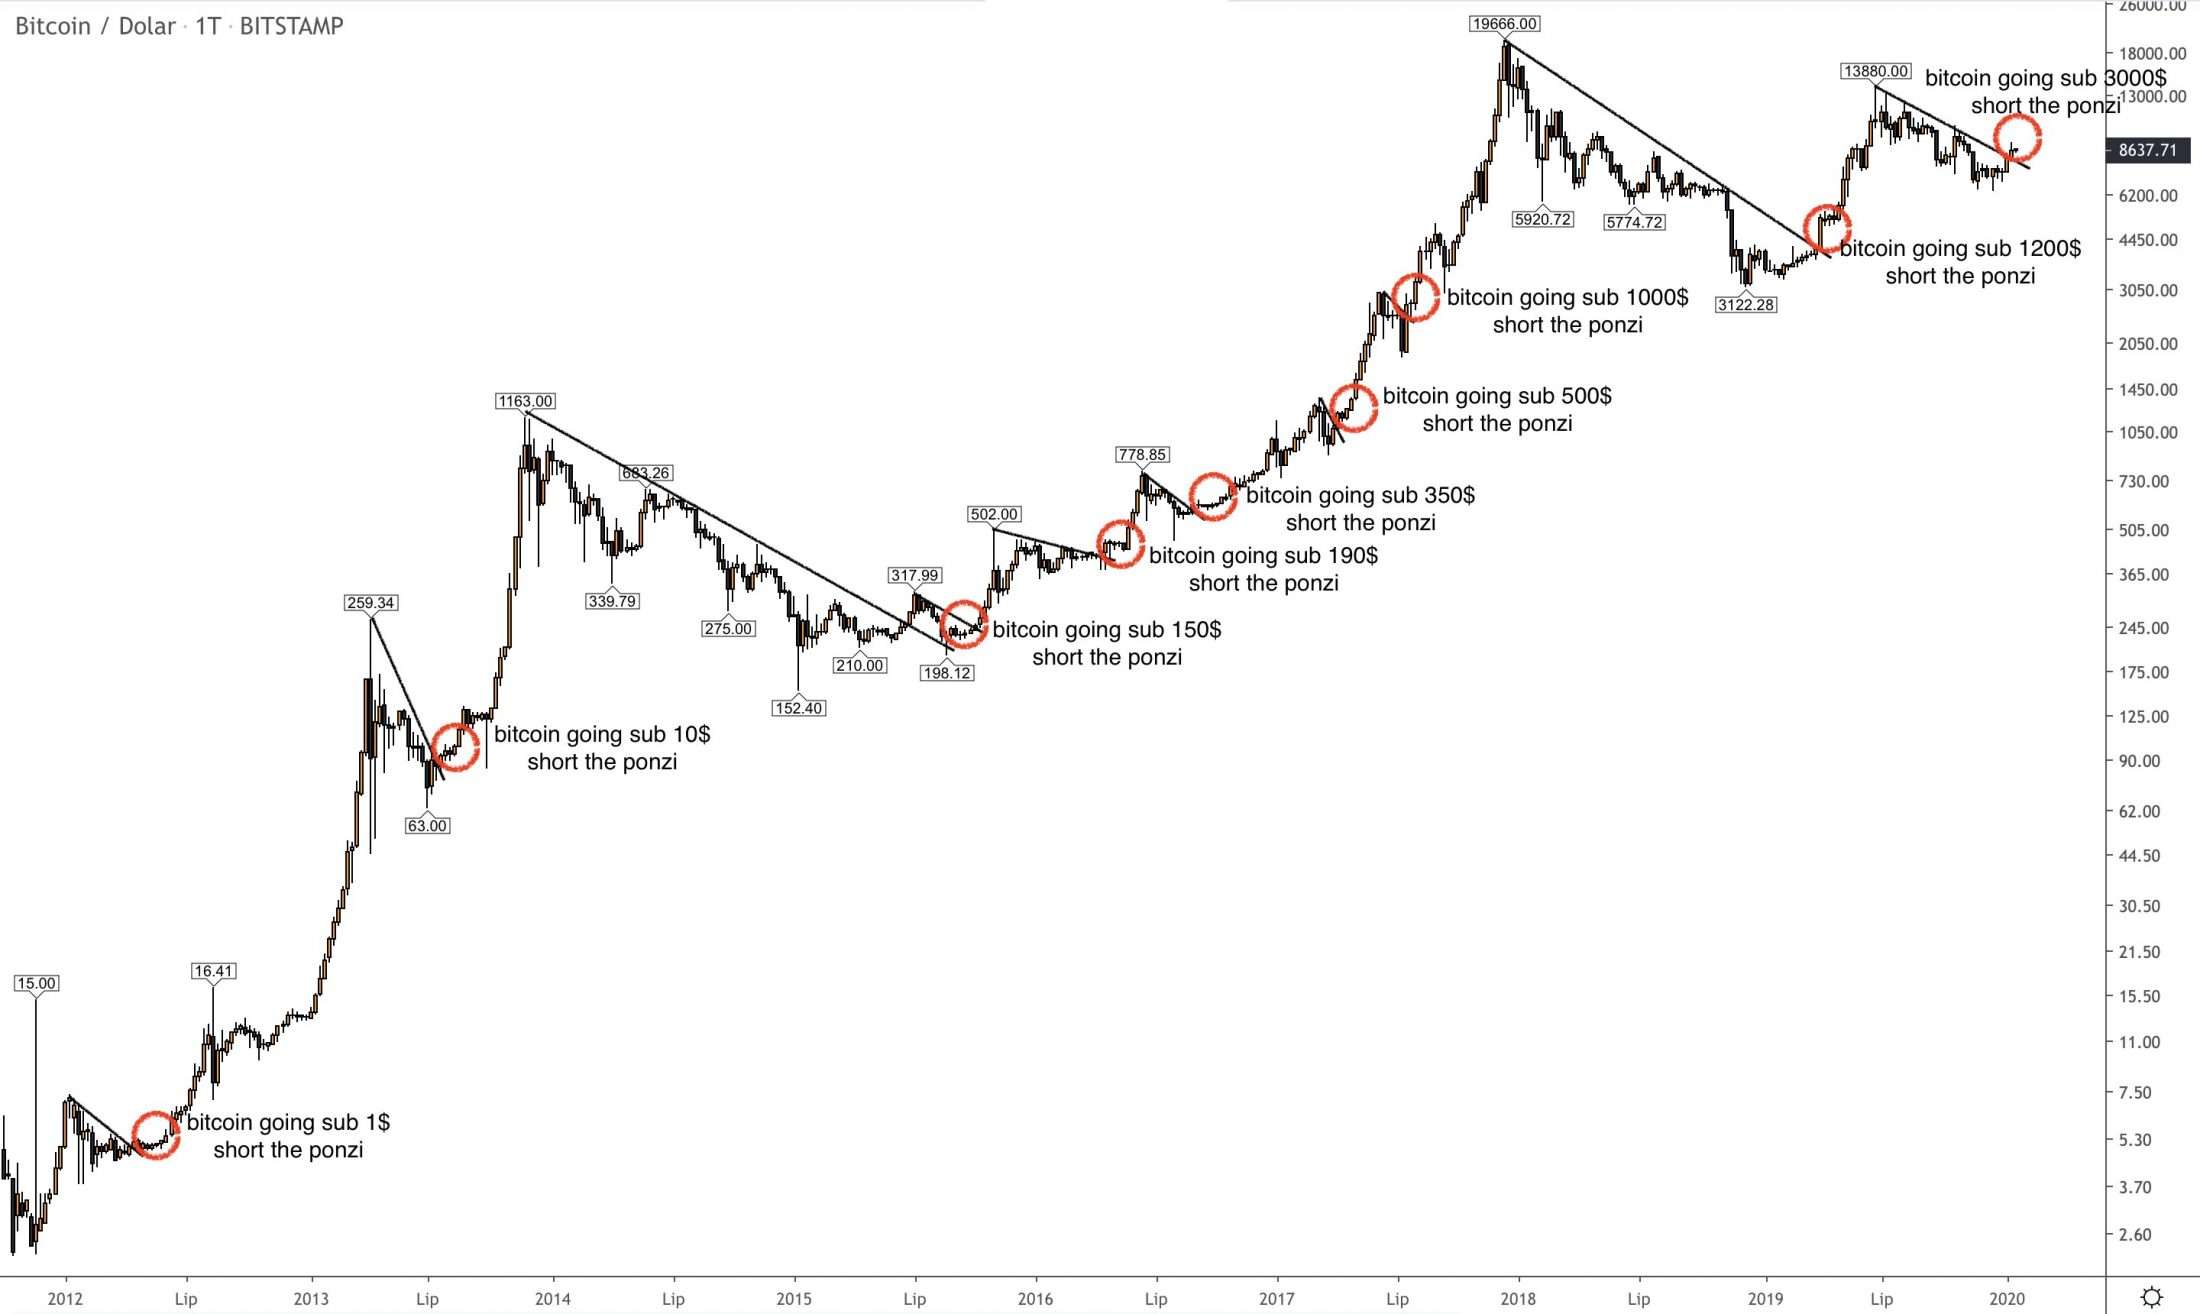
I saw this post from Crypto Birb and I had to include it in this article because it does a great job of highlighting Bitcoin from a macro perspective. As you can see from the chart above, Bitcoin rarely decreases after breaking above a descending trend line from the previous bear market.
Weekly
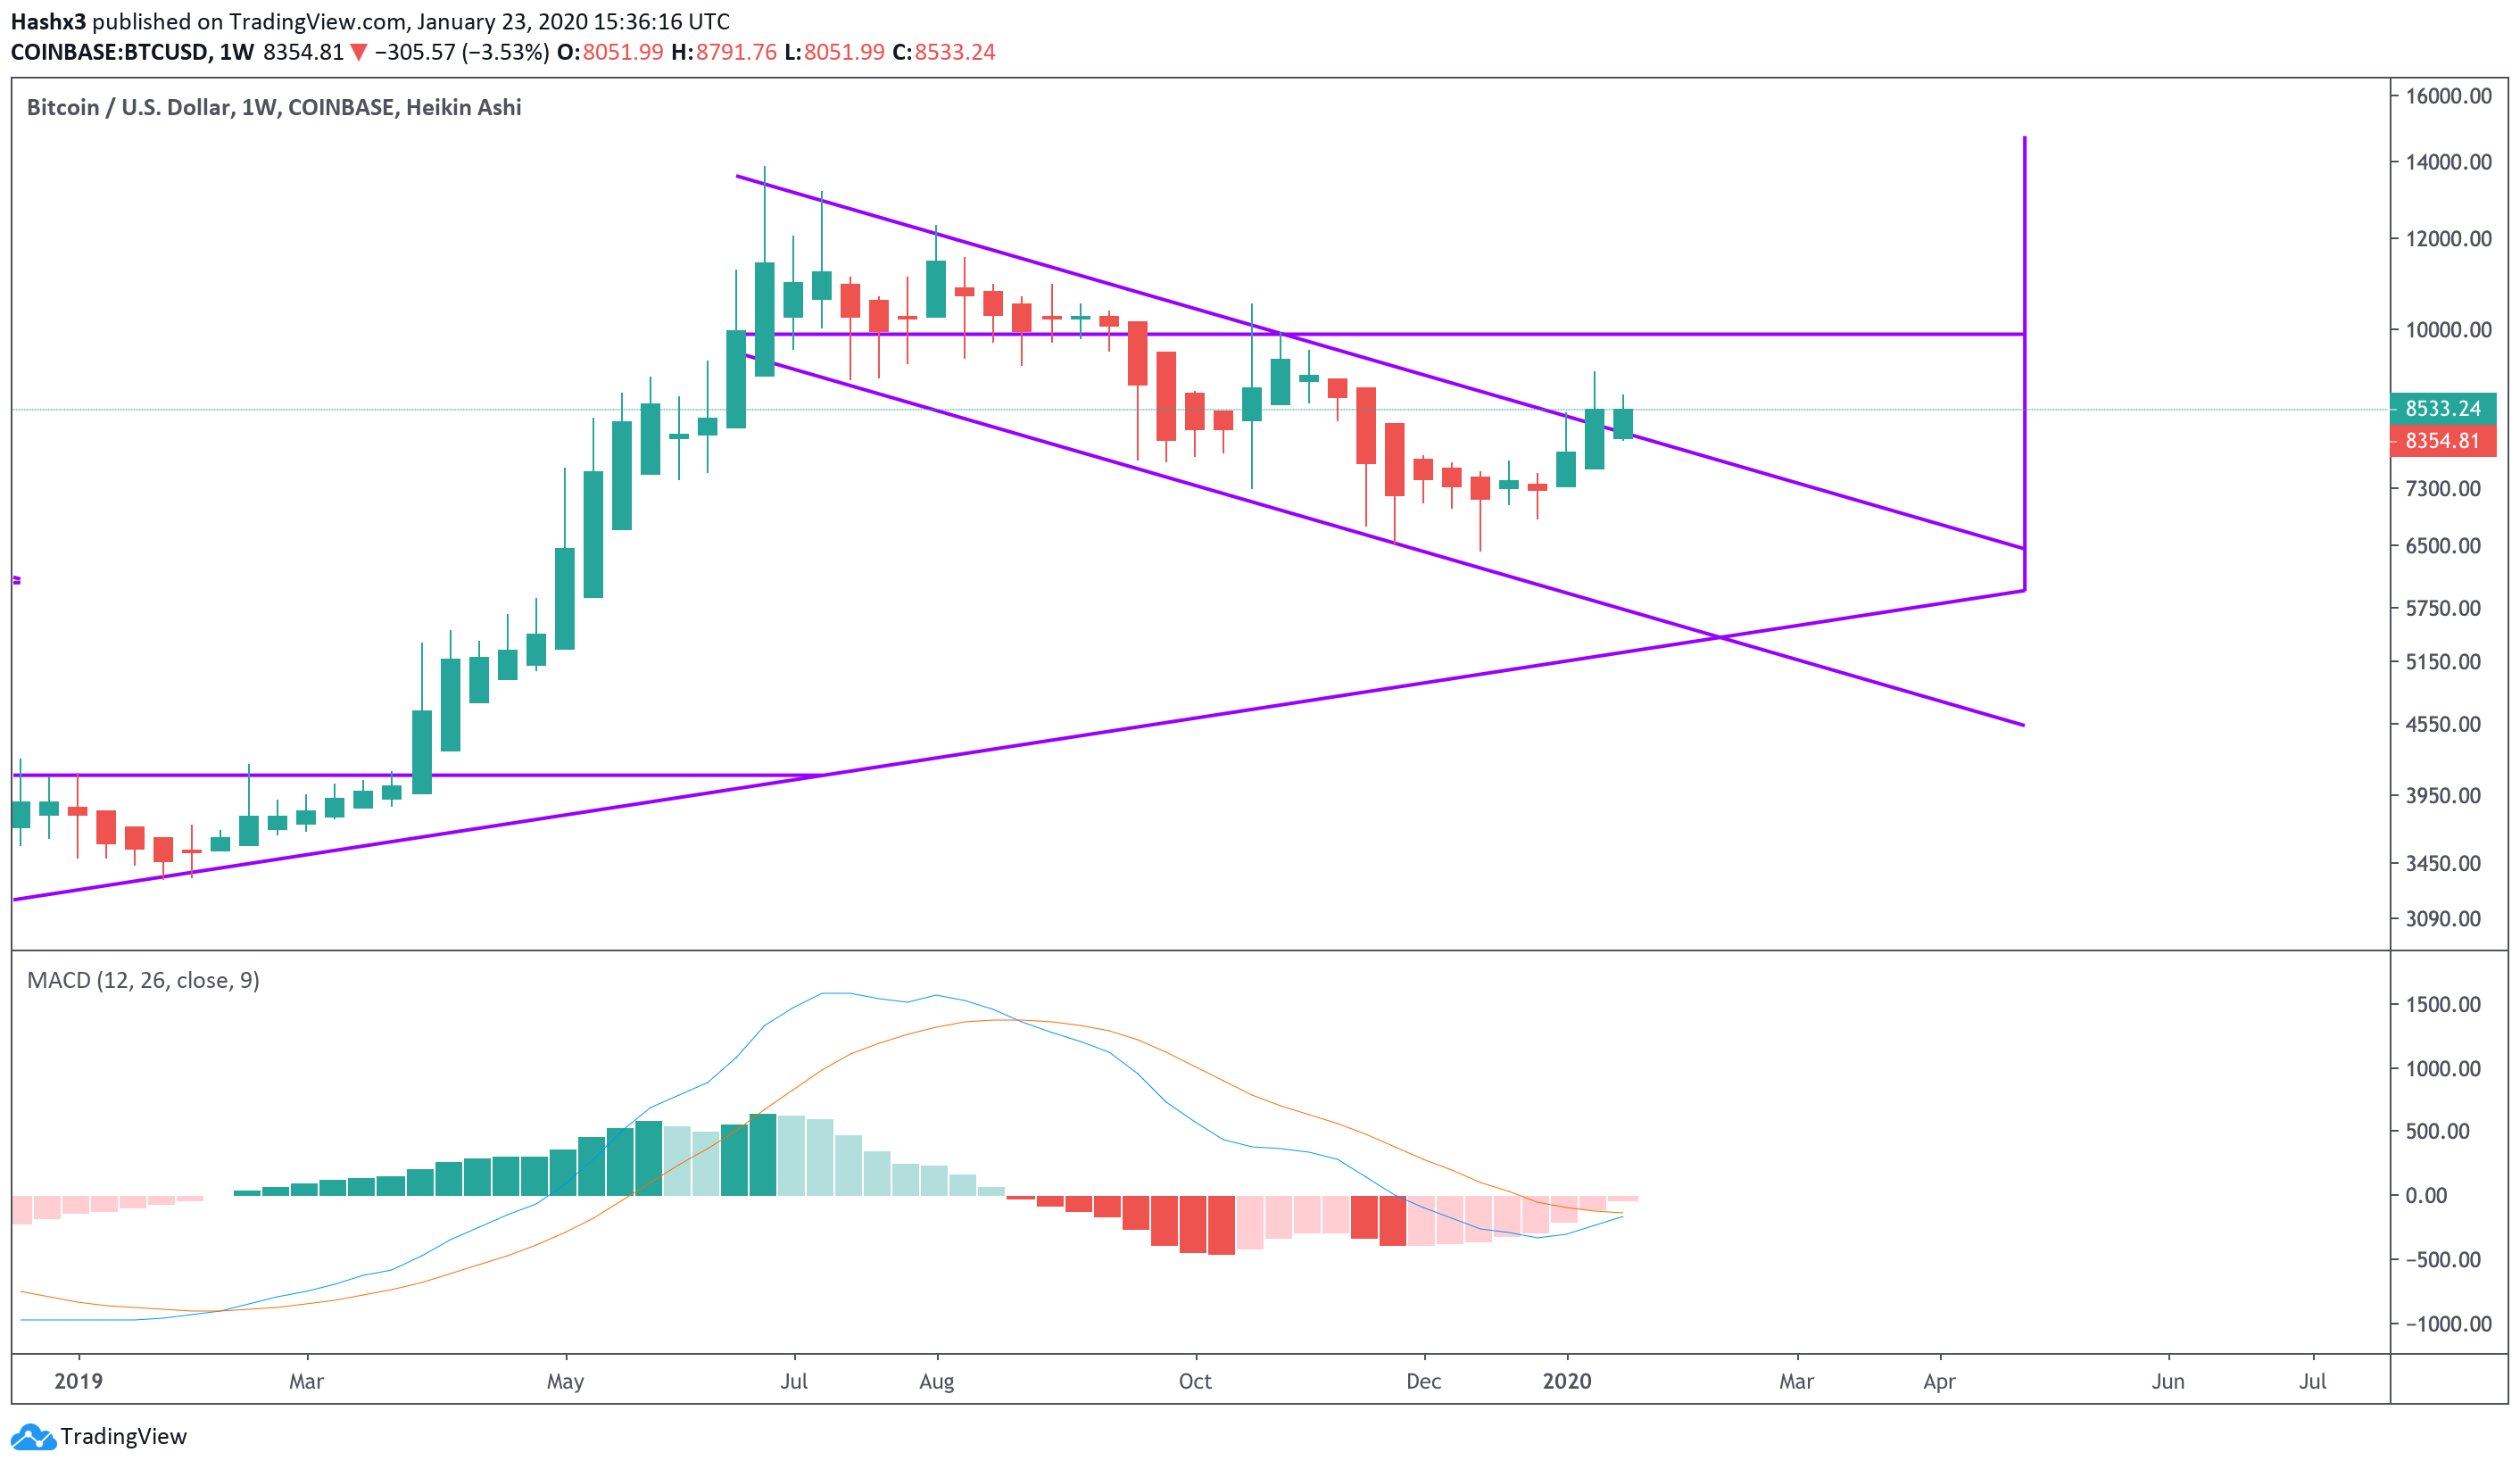
While Bitcoin is bearish on shorter term time frames, the weekly chart remains bullish. The most significant indicator, in my opinion, is currently the MACD on the weekly chart. We are about to create a bullish crossover on the weekly MACD and the last time we had a bullish crossover, we rallied from $4k-$14k in only three months. Additionally, price has created three green Heikin Ashi candles on the chart above. The last time price gave us three consecutive green candles was when we peaked at $14k.
Conclusion
Short term price fluctuations have the potential to distract us from the macro bullish thesis. Unless the technicals and fundamentals change on the weekly chart, we remain bullish going into the May block halving. Being said, we do expect short term bearish price action to continue unless a the short squeeze occurs. Stay sharp, stay discipline, and have a great day:)