
Cryptocurrency
Trading Bitcoin: Bears Taking Over
Bears Taking Over Bears taking over: In yesterday’s article, we mentioned that a red 2 closing below a red 1 is an indication to take a short trade. At yesterday’s close, the sequential indictor told you to take a short trade. If you decided to take this trade you would still be in your position […]
Bears Taking Over
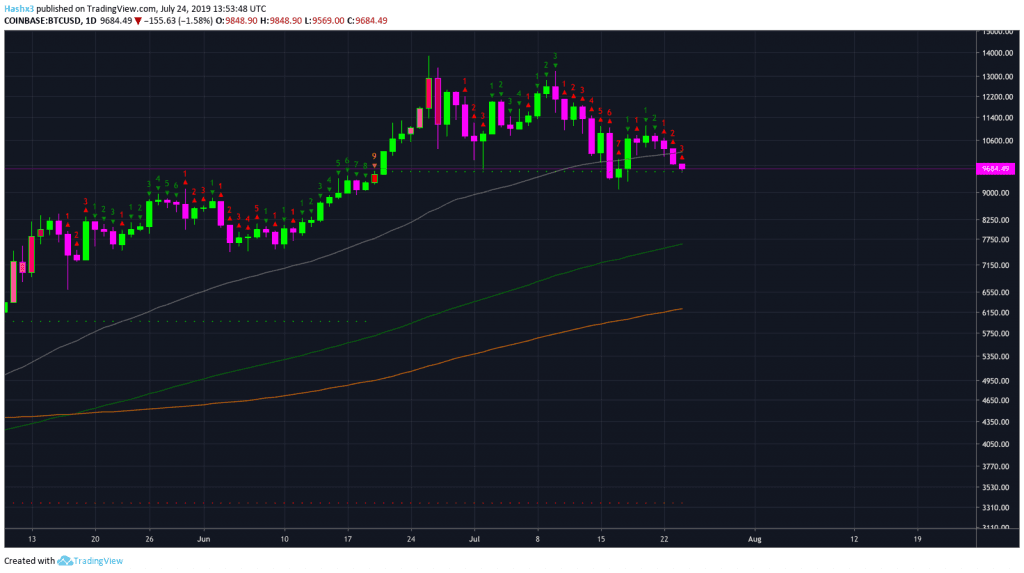
Bears taking over: In yesterday’s article, we mentioned that a red 2 closing below a red 1 is an indication to take a short trade. At yesterday’s close, the sequential indictor told you to take a short trade. If you decided to take this trade you would still be in your position with a small profit. On the daily chart above, Bitcoin is on a red 3 of 9 candle. Furthermore, sequential is telling us there will be more downside potential for the next 4 days. While Bitcoin has broken below the 50MA (grey) on the daily chart, it still has the sequential setup trend line for support. If support is broken at the $9.5k price level, an immediate retest of $9k support is very likely.
4 Hour
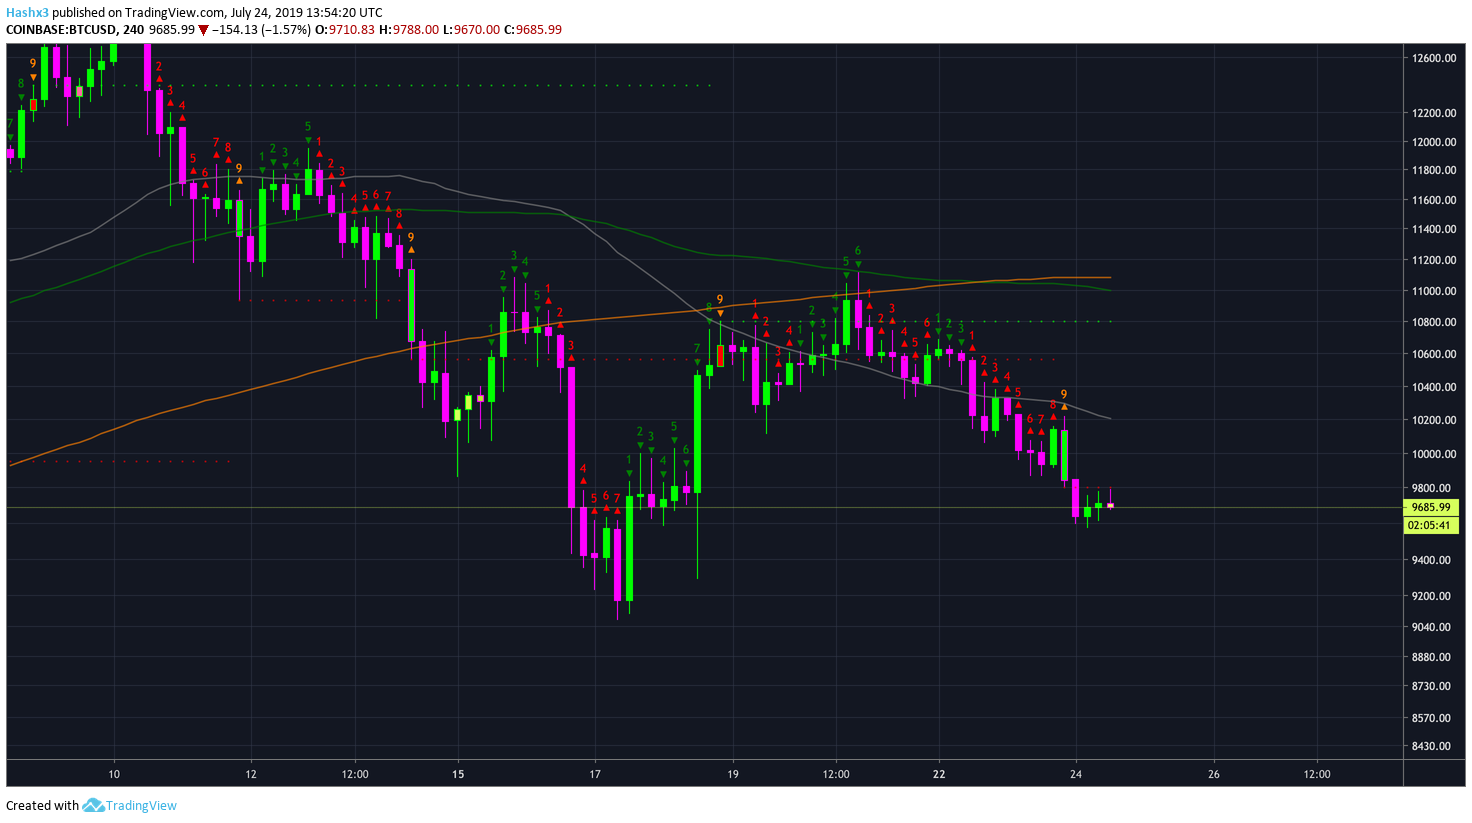
The 4 hour chart above recently entered a recycle period after bottoming on a buy 9. Price is currently neutral-bearish on the 4 hour.
Weekly
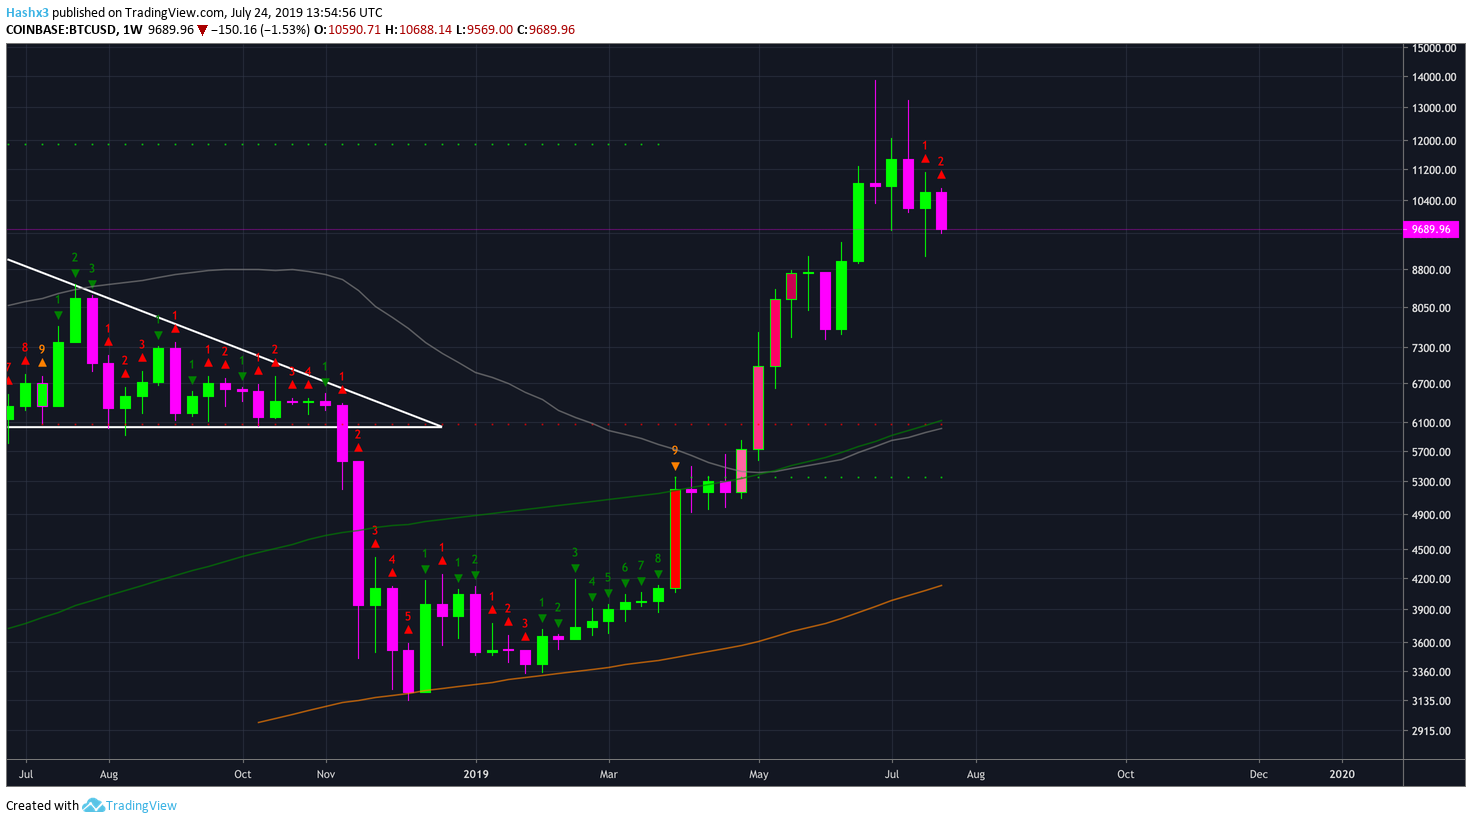
In yesterday’s article, we noted that a red 2 closing below a red 1 on the weekly chart is also an indication to take a short trade. However, Bitcoin must fall an additional $600 for this situation to occur. Even if Bitcoin falls $600, as a trader it ruins your risk-to-reward ratio since Bitcoin topped at $14k. Therefore, the optimal time to short, according to sequential, would be today with a red 3 going below a red 2 on the daily.
Dollar Index
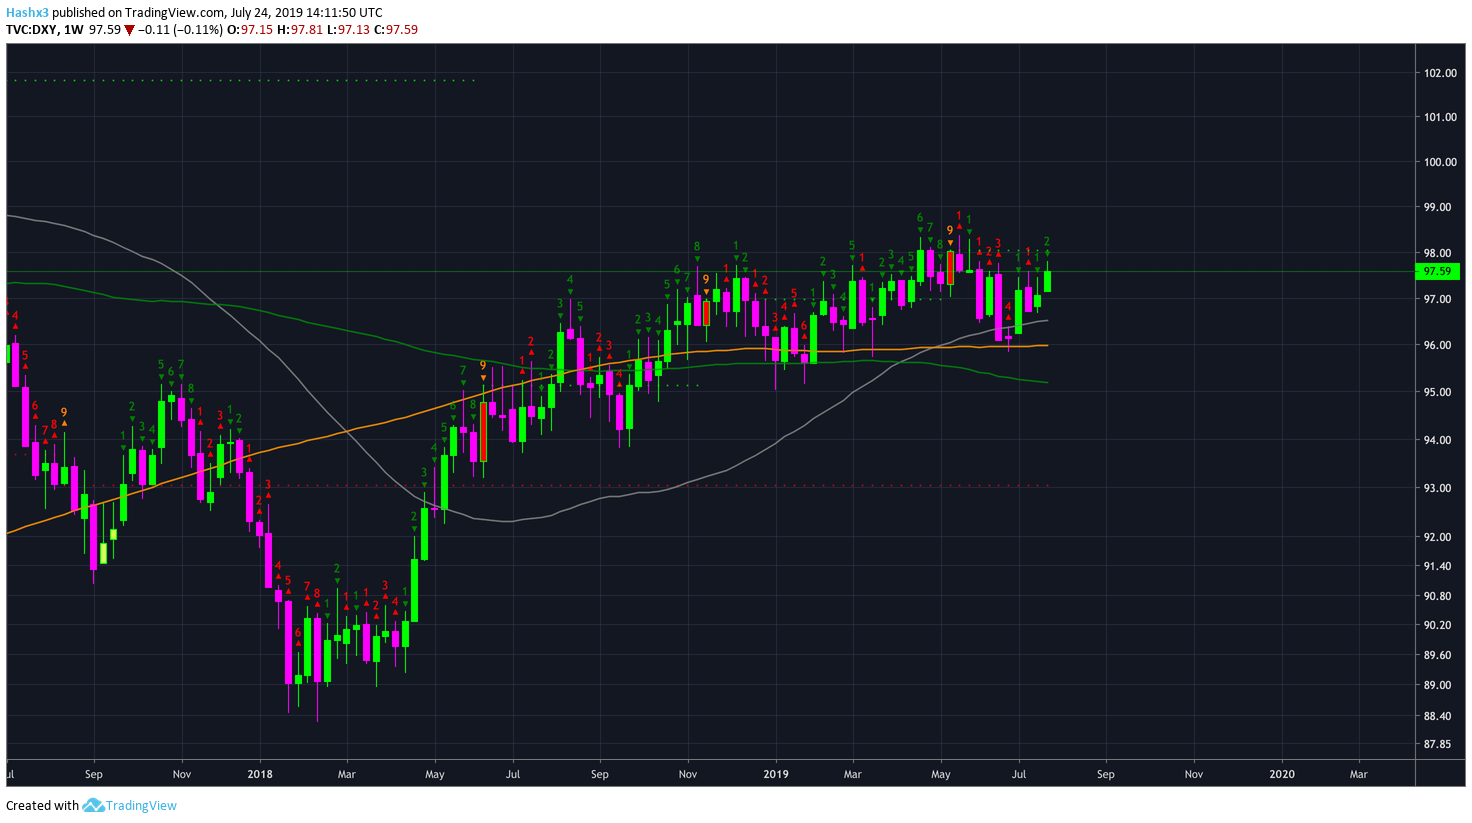
The US Dollar is looking very strong. On the weekly chart above, the Dollar is on a green 2 going above a green 1. Therefore, sequential is telling you to place a long trade, or hold the US Dollar. Also, the Dollar is on its way to making new yearly highs. If the dollar succeeds in creating new yearly highs, it will be bearish for Bitcoin and Gold.
Gold
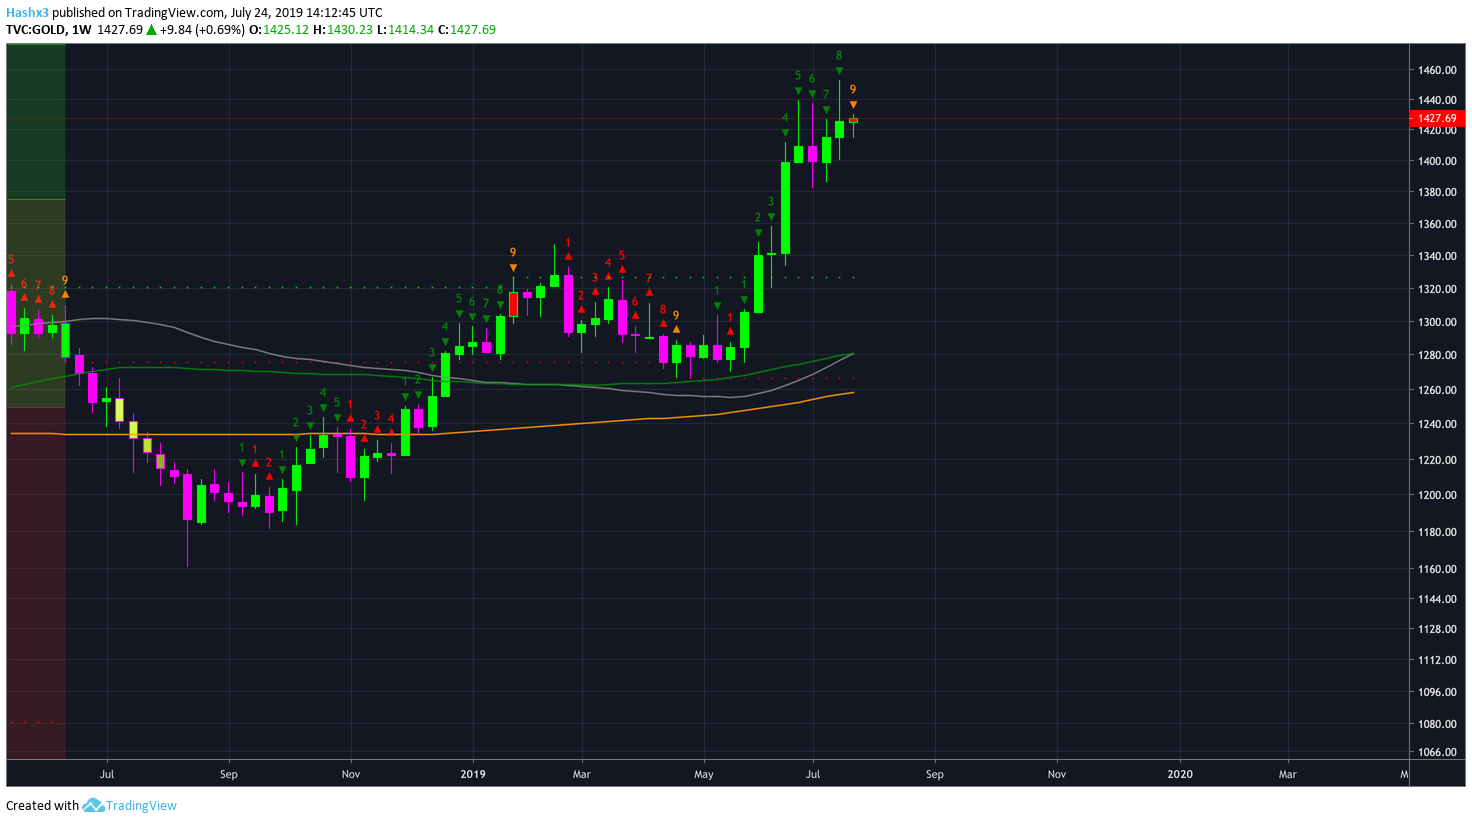
Gold has experienced an incredible rally throughout the past 9 weeks. However, price has now reached a 9 sell candle on the weekly chart above. The strengthening US Dollar and the reversal 9 are looking very bearish for gold. Additionally, gold is topping on a doji candle, which is typically characteristic of a reversal.
Conclusion
The sequential indicator is telling us to short Bitcoin on a daily time frame. The dollar is looking very bullish as it approaches new yearly highs. If the dollar records new yearly highs it will be bearish for both Bitcoin and gold. Overall, the technicals for Bitcoin are still bearish. Critical support remains at $9.5k and $9k.