
Cryptocurrency
Trading Bitcoin: Bounce From $7.5k Now What?
Bounce From $7.5k, Now What? After a bounce from support at $7.5k, Bitcoin is now retesting resistance at $8k. While viewing the daily chart above, Bitcoin is now trading at roughly $7.9k with support from the 50MA (blue) at roughly $7.2k. In order for the bulls to sustain momentum, price must continue to close above […]

Bounce From $7.5k, Now What?
After a bounce from support at $7.5k, Bitcoin is now retesting resistance at $8k. While viewing the daily chart above, Bitcoin is now trading at roughly $7.9k with support from the 50MA (blue) at roughly $7.2k. In order for the bulls to sustain momentum, price must continue to close above both the 0.236 fibonacci support level and the 50MA (blue).
4 Hour
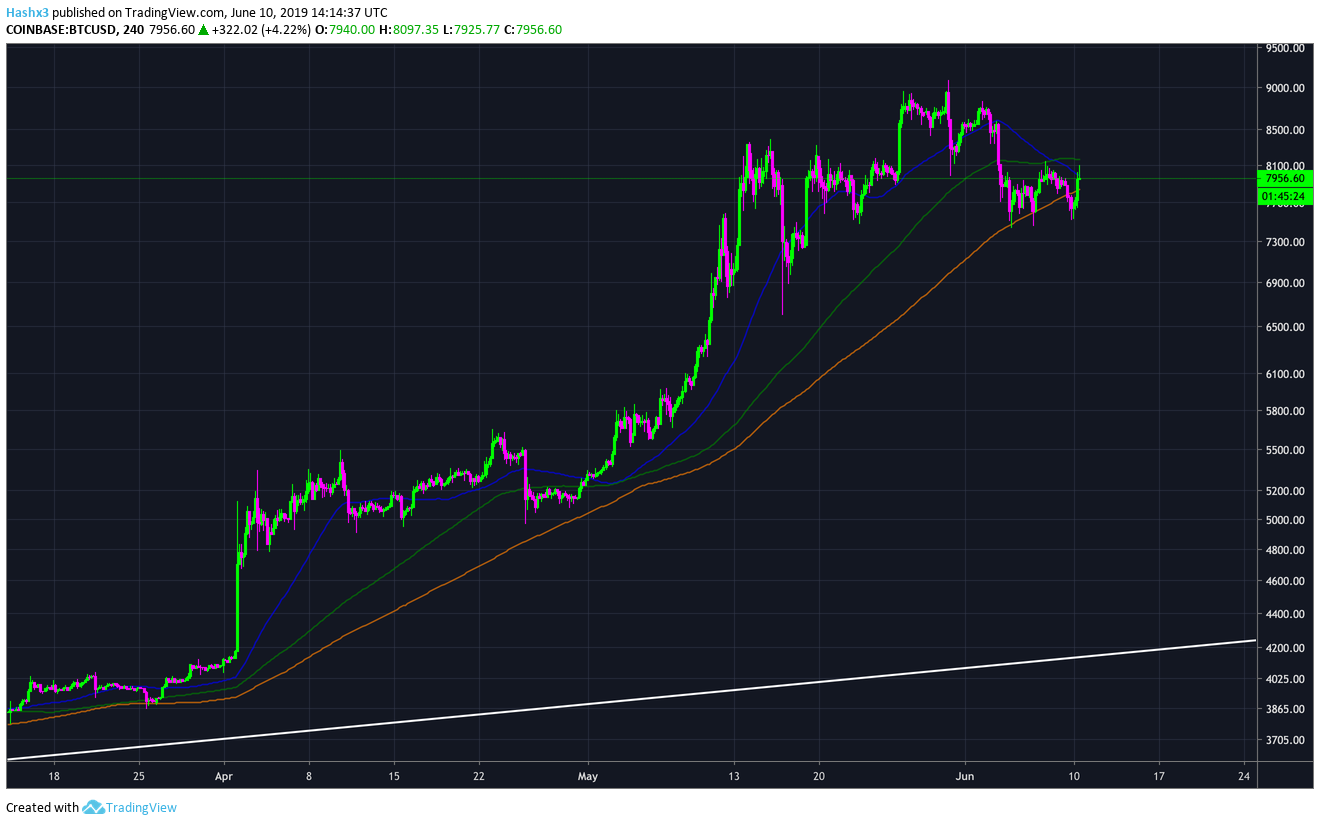
Yesterday, price briefly fell below the 200MA (orange). Price has now recovered and is using the 200MA (orange) as support. The 128MA (green) and 50MA (blue) are forming resistance at roughly $8.1k. The 200MA (orange) on the 4 hour chart has been a critical area of support throughout the May uptrend. As we’ve mentioned in previous articles, if price should fall below the 200MA support level look for a test lower.
Weekly
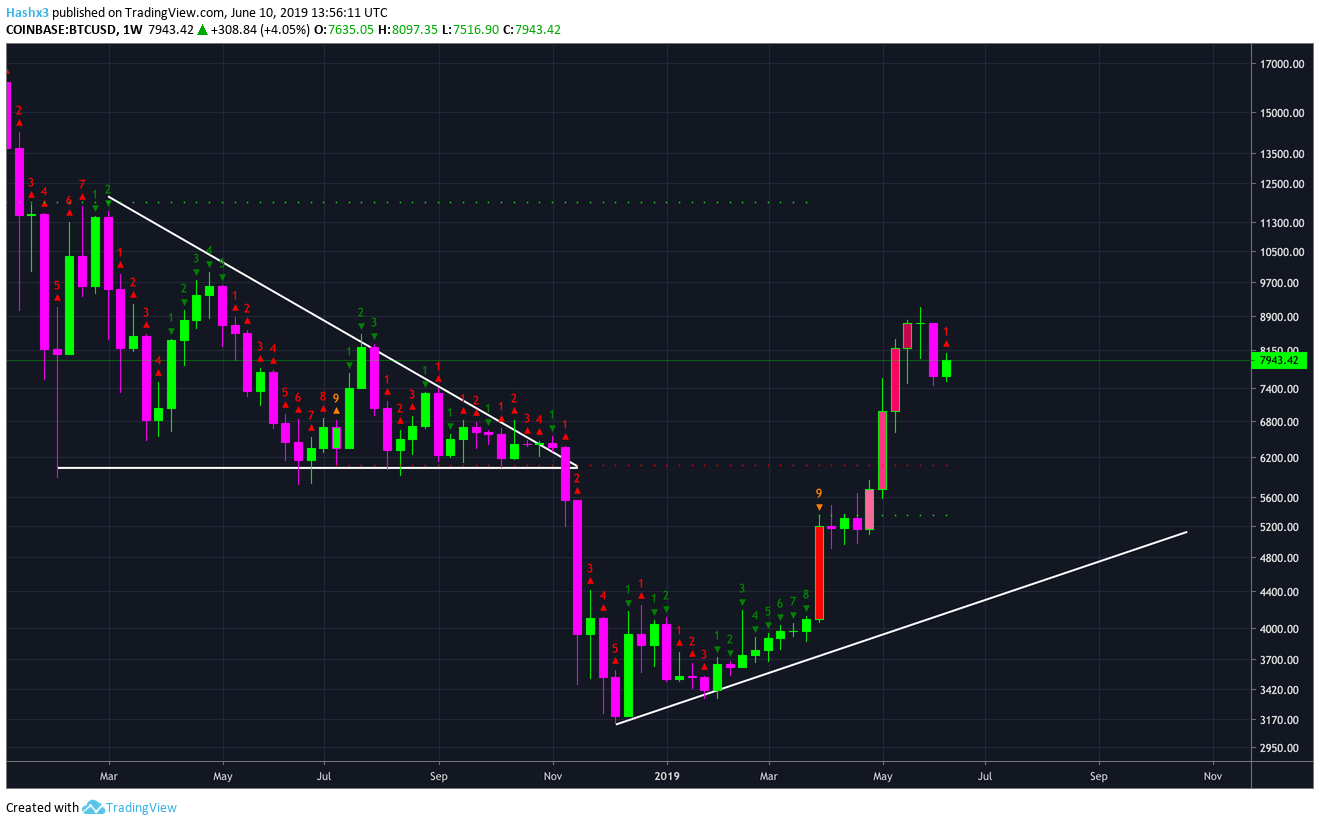
Last week, price flipped on a green 9 after forming a textbook doji candle. This kind of doji is typically a sign of a trend reversal. Also, this was the second 9 in a row, furthermore, price technically hit a sequential 18 which is very indicative of a trend exhaustion. Currently, the sequential indicator is on a red 1 of 9 candle. If the macro trend is to remain bullish, look for a 1 to 4 red candle correction before another uptrend. Therefore, sequential is telling us there are likely four more weeks of downward or sideways price action before the bull market resumes.
Conclusion
The bulls face resistance at $8k and $8.3k. Support remains at $7.6k and $7.2k. Look for a buying opportunity if price should fall to a target of $6.4k in the next four weeks. After May’s extraordinary price increase, we expect a 1-4 candle correction on the weekly chart before another bull run. Hodlers should look to buy the dip if an opportunity should present itself within the next four weeks. If the bulls can break above $8.3k, look for a possible retest of $9k.
Disclaimer: The author of the article owns bitcoin.