
Cryptocurrency
Trading Bitcoin: False Breakdown? Back in the No Trade Zone
Back in the No Trade Zone After experiencing a false breakdown yesterday, Bitcoin is in the no trade zone while price is back above $8k. For the past few weeks, we have noted that Bitcoin has fluctuated in a no trade zone from $8k-$8.5k. Yesterday, price briefly broke below the $8k support level and bounced […]
Back in the No Trade Zone
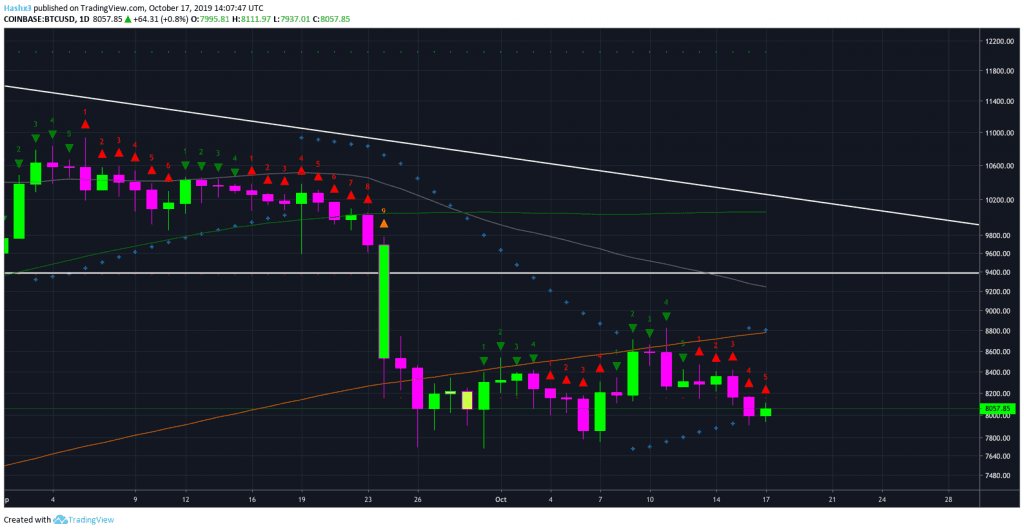
After experiencing a false breakdown yesterday, Bitcoin is in the no trade zone while price is back above $8k. For the past few weeks, we have noted that Bitcoin has fluctuated in a no trade zone from $8k-$8.5k. Yesterday, price briefly broke below the $8k support level and bounced back today as a false breakdown. On the daily chart above, Bitcoin is on a red 5 of 9 candle. According to sequential theory, a short trade was activated when the red 3 closed below the previous red 1 & 2. If you took this short trade, you would still be sitting in a profitable position. Additionally, the 200MA (orange) is still serving as resistance for the bulls at $8.8k.
4 Hour
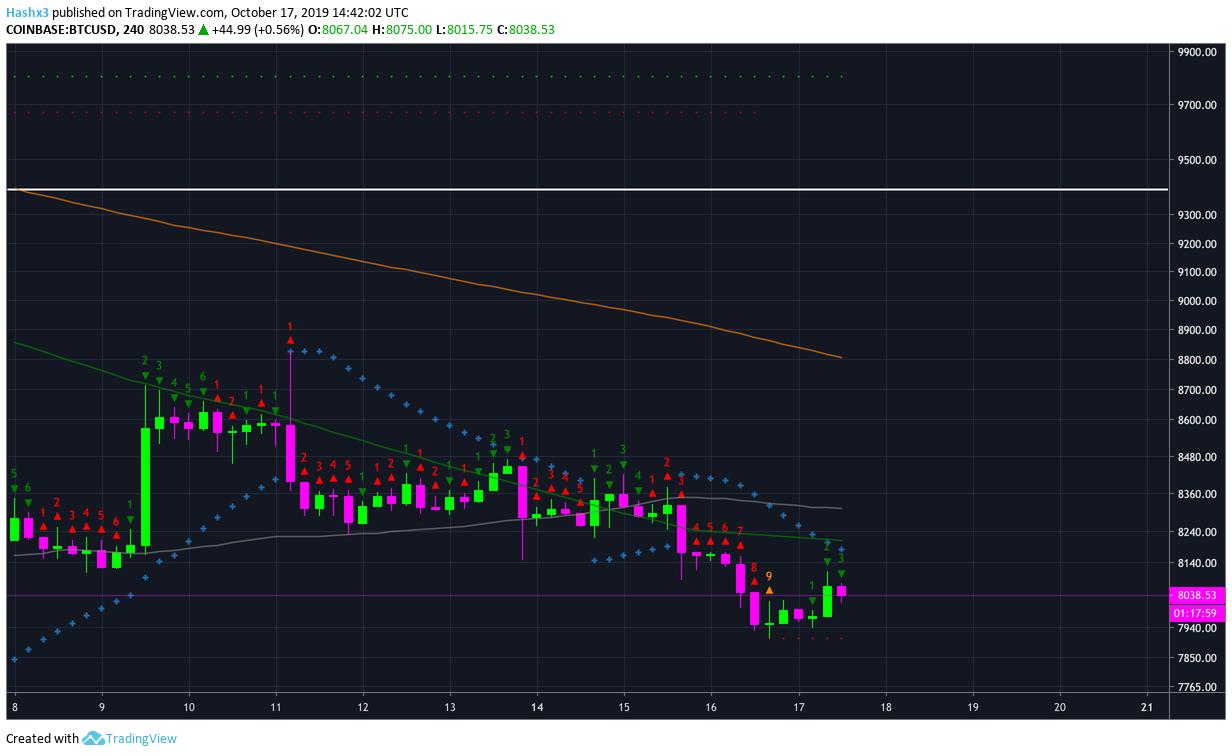
Bitcoin’s 4 hour chart is nothing short of beautiful when it comes to sequential theory. In sequential theory, when the trend reaches a 9, it is an indication of a large move or potential reversal. As you can see from the chart above, Bitcoin’s trend perfectly bottomed on the red 9 and is now on a green 3. In sequential theory, a green 2 closing above the previous green 1 is an indication to place a long trade. However, Bitcoin still faces all three moving averages on the 4 hour chart, which will serve as resistance for the bulls. Additionally, the Lucid SAR (blue x) is in a bearish position above price. In order to be bullish, we look for confluence between these indicators. While sequential is telling us price action has the potential to be bullish, the moving averages are telling us bullish momentum will likely be short-lived.
Conclusion
Bitcoin’s 4 hour chart recently bottomed on a red 9. While a small reaction rally is possible, it is likely that a prompt rejection will follow if a rally is to occur. For now, Bitcoin remains in a no trade zone from $8k-$8.5k. The majority of indicators on the daily chart are calling for a further decline to the $6k-$7k price channel.