
Cryptocurrency
Trading Bitcoin: Rejected at $11k
Rejected at $11k Yesterday, Bitcoin experienced a large reaction rally after this weekend’s significant decline. However, yesterday’s rally was rejected at $11k and Bitcoin is currently trading at $10.4k. After being rejected at $11k, Bitcoin has created another lower high. Furthermore, the technical structure of the trend is beginning to look bearish. In fact, Bitcoin’s […]

Rejected at $11k
Yesterday, Bitcoin experienced a large reaction rally after this weekend’s significant decline. However, yesterday’s rally was rejected at $11k and Bitcoin is currently trading at $10.4k. After being rejected at $11k, Bitcoin has created another lower high. Furthermore, the technical structure of the trend is beginning to look bearish. In fact, Bitcoin’s current trend structure looks very similar to the top which occurred at the height of 2017. On the daily chart above, Bitcoin is on a red 6. Therefore, sequential is telling us that Bitcoin has more downside potential in the near term. Also, our sequential set up trend line (dotted green line) is acting as support at $9.5k. As of now, Bitcoin’s trend structure is bearish. Until price can break above the prior high of $12.5k, the structure of the trend remains bearish.
4 Hour
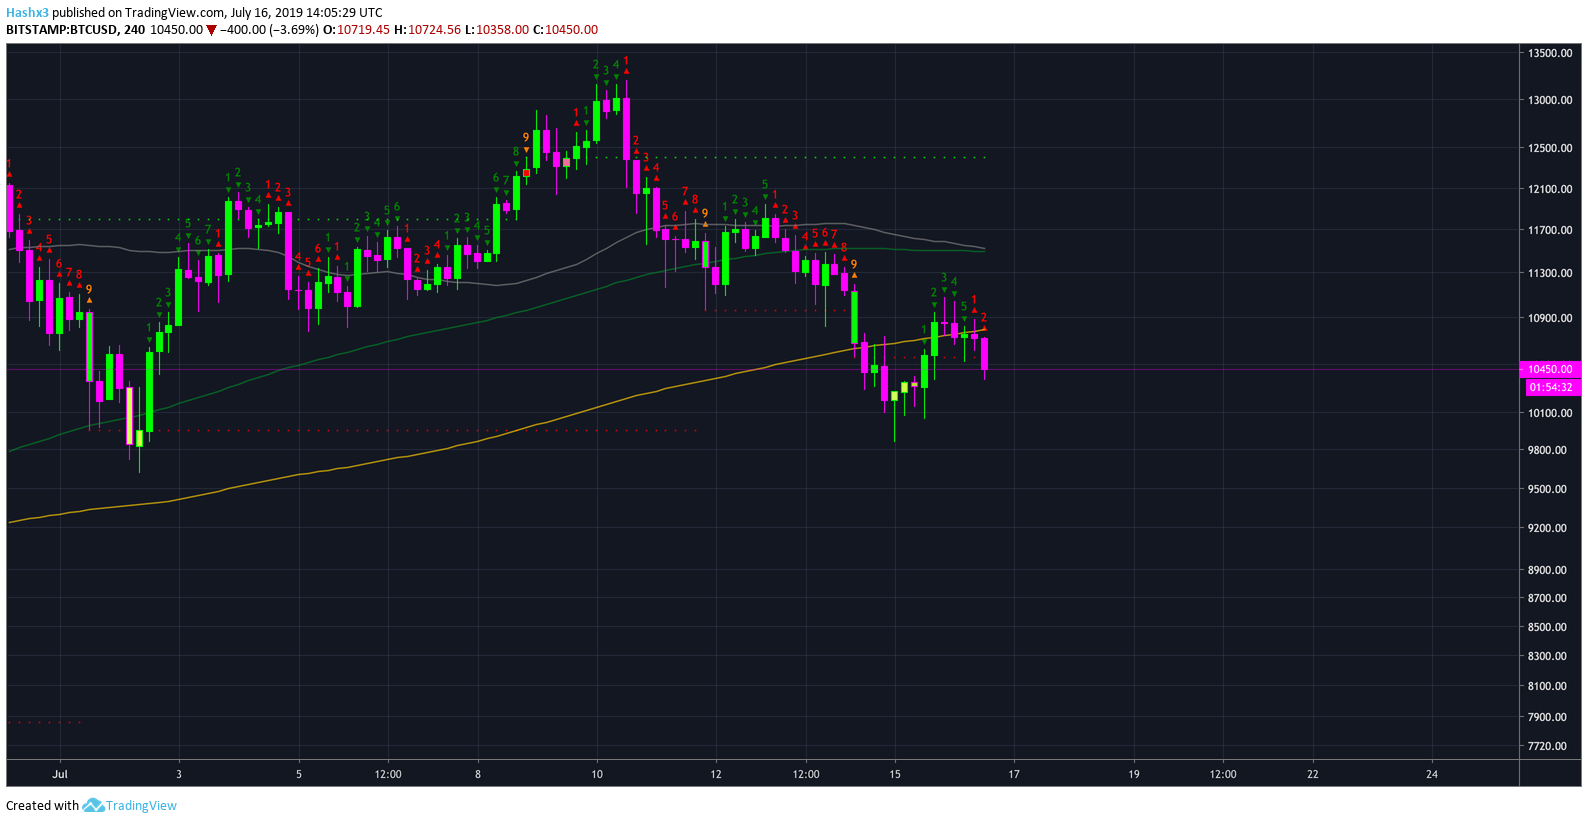
Yesterday’s reaction rally took us above the 200MA (orange) however, price has now closed below the 200MA (orange) which should act as resistance. Additionally, the sequential indicator is on a red 2. Furthermore, a red 2 closing below a previous red 1 is an indication to take a short trade. While it is very dangerous to short Bitcoin in general, sequential theory is telling you to place a short trade assuming you’re trading based on the 4 hour chart.
LTC/BTC
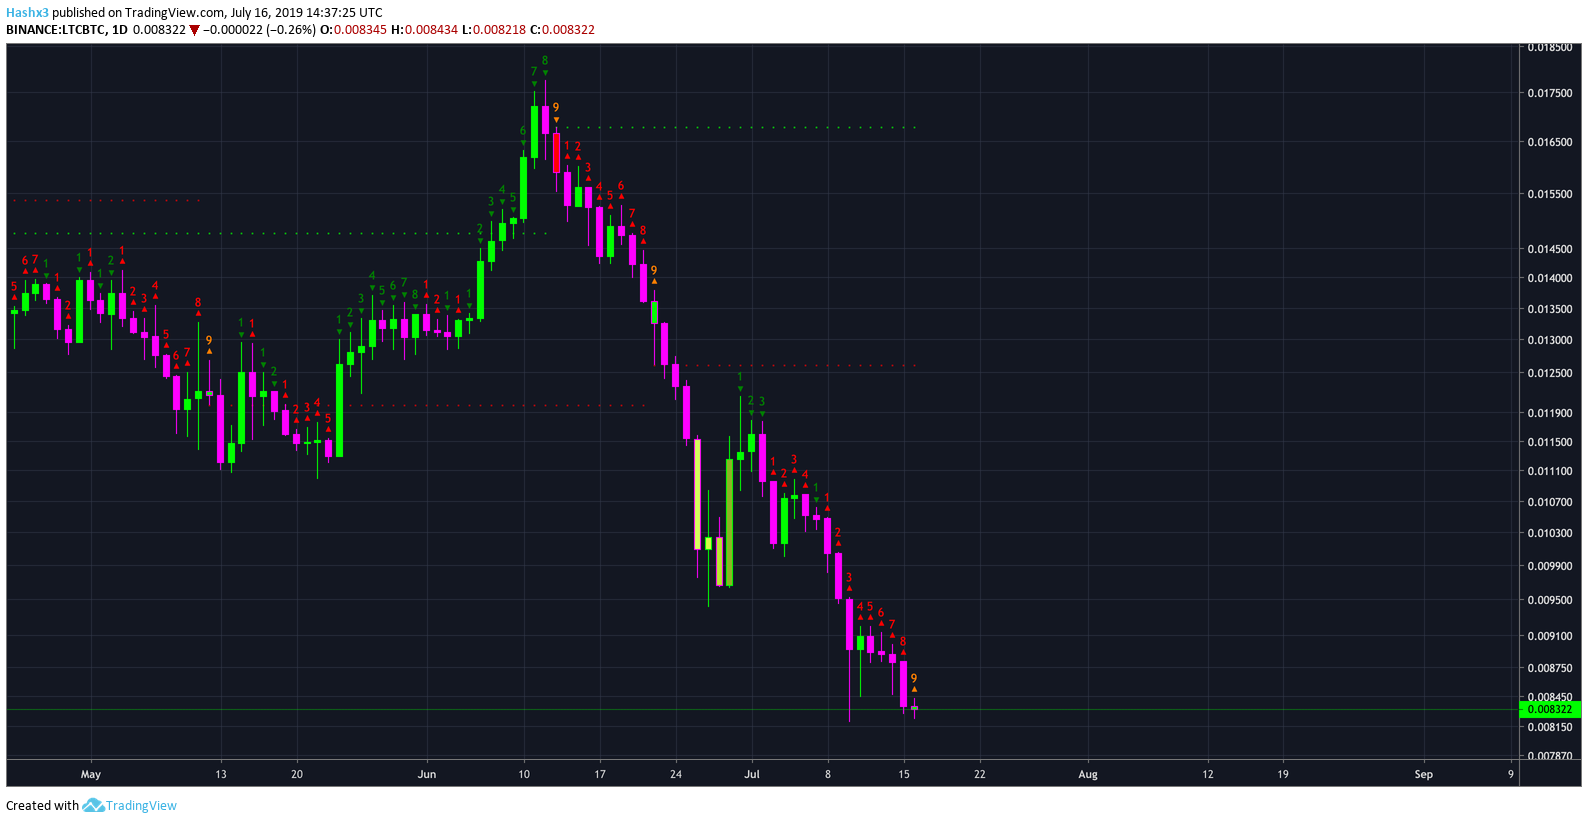
Litecoin is on a perfect reversal 9. According to sequential theory, Litecoin’s bearish trend is about to reverse. On the chart above, you can see we are on a red 9 which is currently in a beautiful doji reversal candle. From a purely technical perspective, Litecoin/BTC looks like an ideal ‘catch a falling knife’ scenario.
Cryptocurrency News
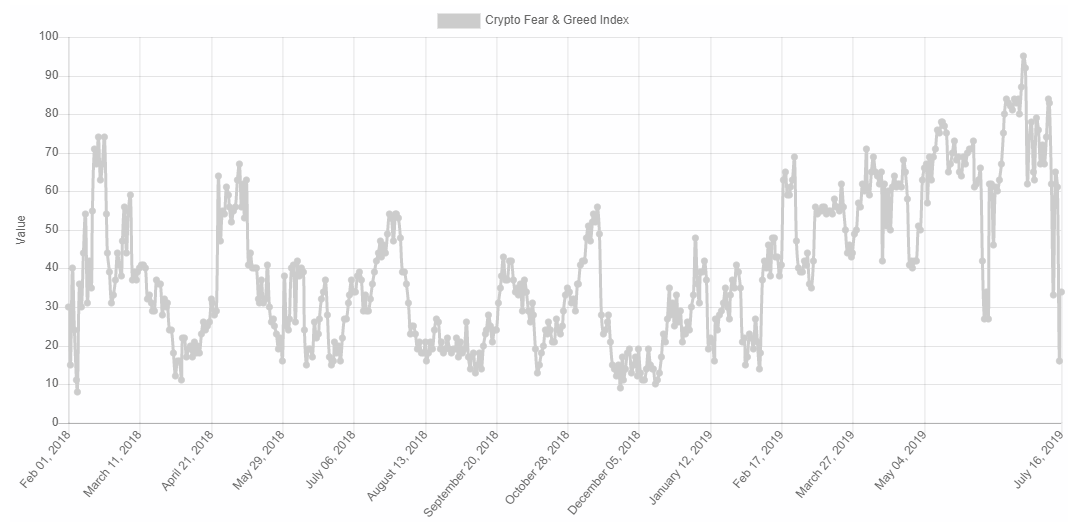
The Crypto Fear and Greed Index has taken a wild ride this past week. The index measures market sentiment and yesterday it dropped to its lowest level since December 2018. What does this mean for the trend and overall technical analysis? We can’t be sure. What we know for certain is that many people who chased the spring rally are becoming fearful. However, we don’t know the price in which these traders will be shaken out. The best current estimate is the $7-8k price region.
Conclusion
After failing to break above $11k, Bitcoin has made a lower high and is in a bearish trend structure after topping at $14k. The sequential indicator is in a bearish countdown phase across multiple timeframes and the NVT indicator has broken below support at 150. Until the bulls can break above $11k resistance, the trend will remain bearish. Bitcoin’s strongest support levels are currently $10k and $9.5k.