
Cryptocurrency
Bitcoin’s Bull Flag Set for $9.4k
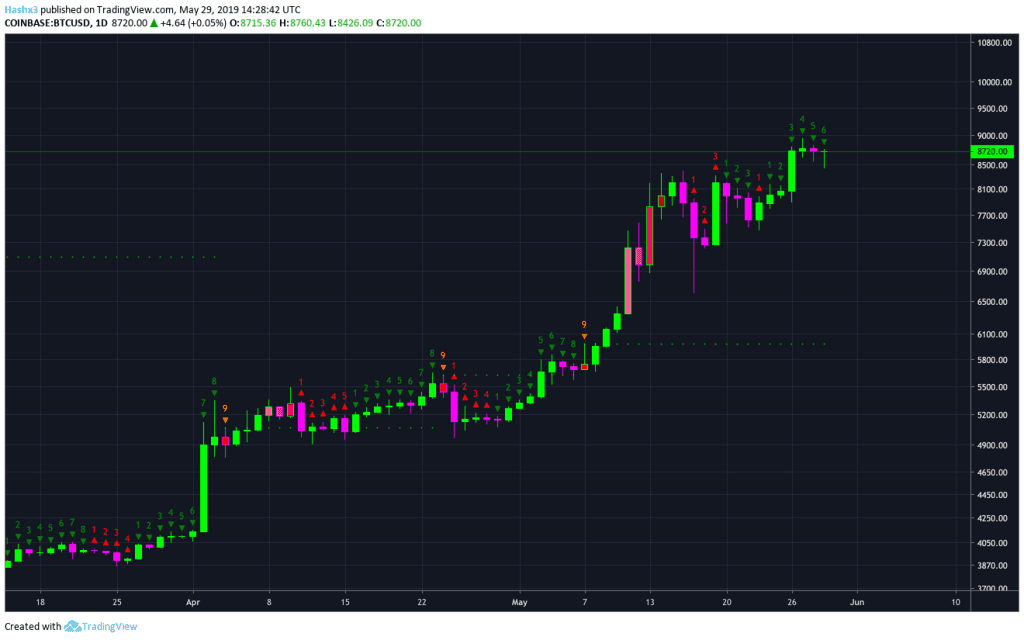
Bitcoin’s Bull Flag Set for $9.4k Bitcoin’s bull flag is set for $9.4k as its falling wedge pattern continues. On the daily chart above, Bitcoin’s sequential indicator is now on a green 6 of 9 candle and is still in neutral territory. The sequential indicator is telling us there are potentially three more days until […]
Bitcoin’s Bull Flag Set for $9.4k
Bitcoin’s bull flag is set for $9.4k as its falling wedge pattern continues. On the daily chart above, Bitcoin’s sequential indicator is now on a green 6 of 9 candle and is still in neutral territory. The sequential indicator is telling us there are potentially three more days until a possible trend reversal. This trend reversal would come in the form of a tentative pullback or rejection. In yesterday’s article, we highlighted the bull flag formation Bitcoin is currently in. If you extrapolate Bitcoin’s bull flag it takes you directly to the resistance channel at $9.4k.
4 Hour
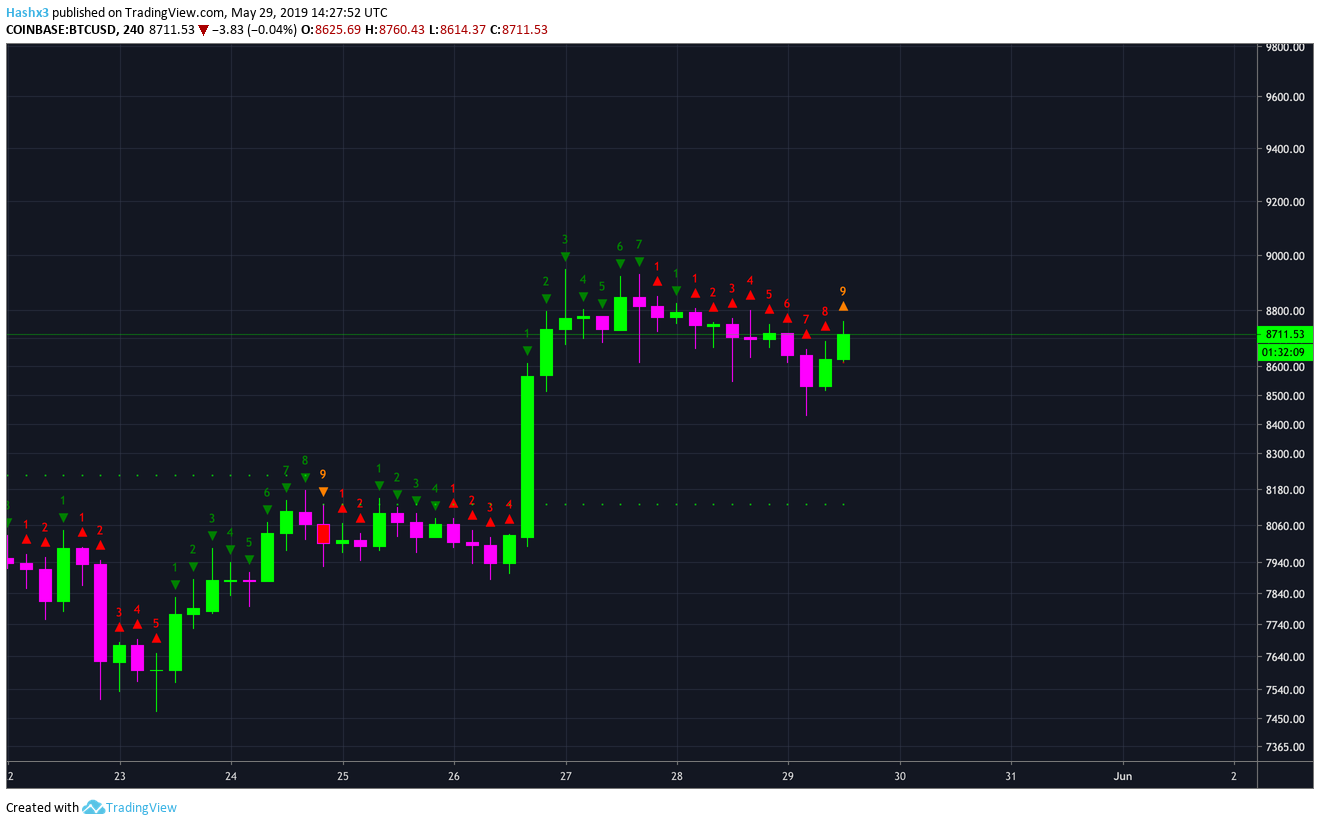
Bitcoin’s 4 hour chart is about to make a red 9 and will likely finish its downward sequence within the next 4 hours. Bitcoin has formed a falling wedge which is characteristically a bullish continuation pattern. It will be interesting to see whether price can flip to a green sequence and start another uptrend. While a bull flag appears to be a likely trade, a pattern means nothing until confirmation.
Weekly
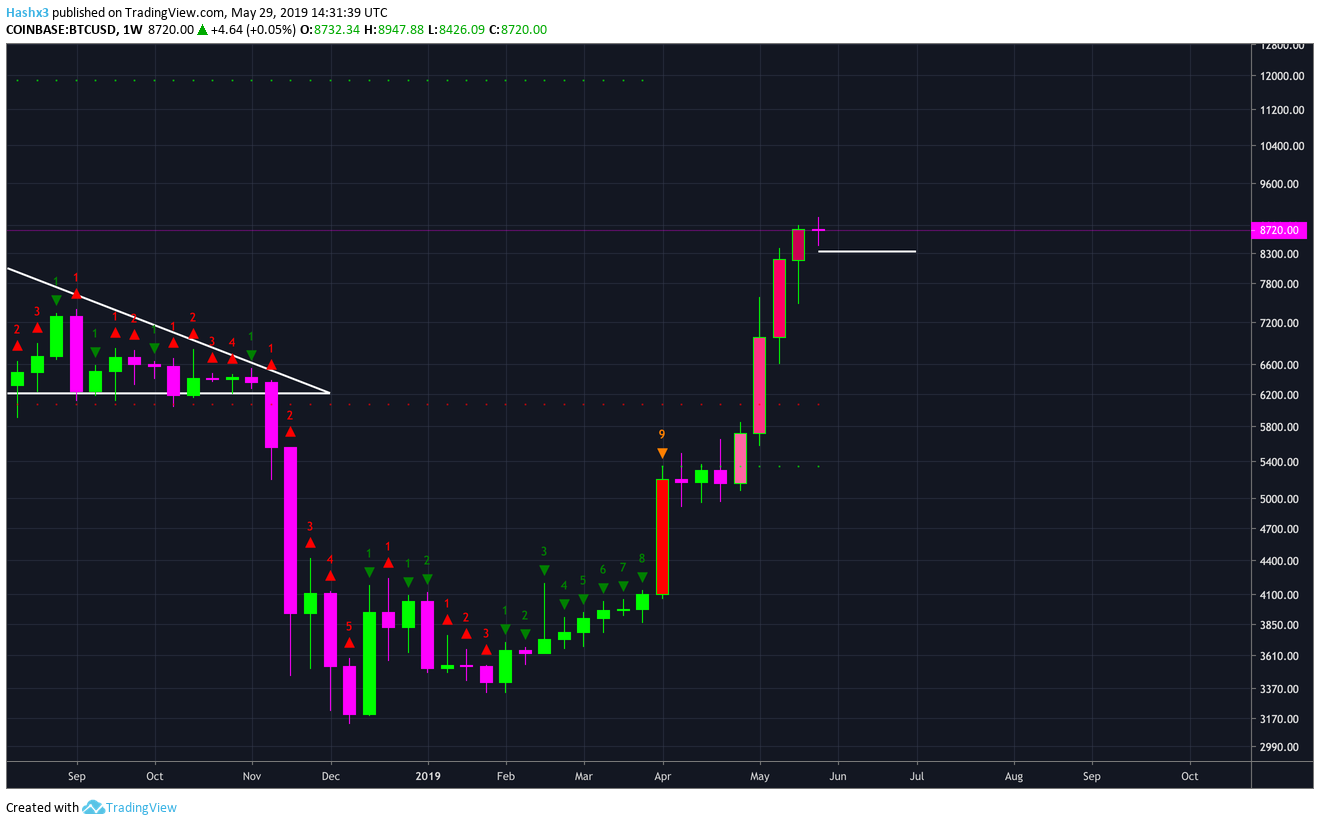
Bitcoin’s weekly chart will make a green 9 on the countdown phase next week. This is Bitcoin’s second green 9 in a row and it will be interesting to see whether the pullback we’ve been waiting for occurs during this time frame. If a pullback were to come, it would likely occur as the sequential indicator hits a green 9 next week after 18 straight weeks of bullish price action. If the pullback occurs before we get the green 9, look to take a potential short trade if price falls below the white trend line on the chart above at roughly $8.2k.
Cryptocurrency News
Bitcoin SV is up 50% today. This move is likely a result of insider manipulation in the form of a pump and dump. Bitcoin SV was delisted from Binance Exchange last month and lost a significant amount of its liquidity. The cryptocurrency was delisted from Binance because the creator, Craig Wright, is a well-known fraud. Newcomers to the cryptocurrency space should steer clear of small cap cryptocurrencies with thin liquidity. While some may be legitimate projects with good intentions, it is impossible to know when an insider is going to pump and dump a coin. Additionally, it’s even worse to chase a 50% move such as the one seen in Bitcoin SV. It will be interesting to see whether Bitcoin SV remains at its current price for the remainder of the week or dumps 40% as a result of the irrational move.
Conclusion
Resistance remains at $8.8k as Bitcoin sets its sights on $9.4k. If price breaks above $9.4k look for a blue sky breakout into the $10k price level. Expect a pullback of 30-40% if price is rejected at $9.4k. If price is unable to reach $9k before the end of next week, prepare for a potential trend reversal. It will be interesting to see how price reacts to the sequential indicator hitting a green 9 on the weekly for the second time in a row. If the pullback occurs before we hit a weekly green 9, look to take a potential short trade if price falls below the white trend line on the weekly chart above at roughly $8.2k.
Disclaimer: I am not a financial advisor. Nothing in this article should be considered financial advice. The author of the article owns Bitcoin.