
Cryptocurrency
Trading Bitcoin: Another Ascending Triangle
Another Ascending Triangle In the short-term, Bitcoin is demonstrating bullish potential. Yesterday’s article highlighted four warning signs which Bitcoin is currently experiencing. While these warning signs are still in play, Bitcoin is beginning to show bullish potential. In the chart above, Bitcoin is forming a tentative ascending triangle on the four hour chart. Ascending triangles […]
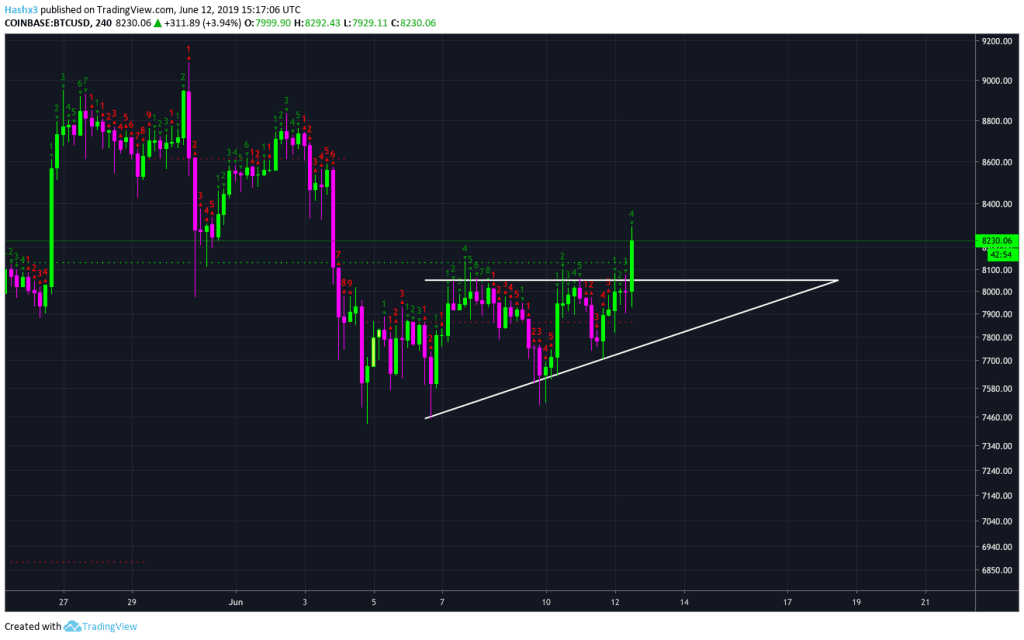
Another Ascending Triangle
In the short-term, Bitcoin is demonstrating bullish potential. Yesterday’s article highlighted four warning signs which Bitcoin is currently experiencing. While these warning signs are still in play, Bitcoin is beginning to show bullish potential. In the chart above, Bitcoin is forming a tentative ascending triangle on the four hour chart. Ascending triangles break to the upside 70% of the time and an ascending triangle sent Bitcoin to $8.8k on May 26th. While patterns mean nothing until confirmation, the ascending triangle would give us a projected target of $8.8k for a retest of prior resistance.
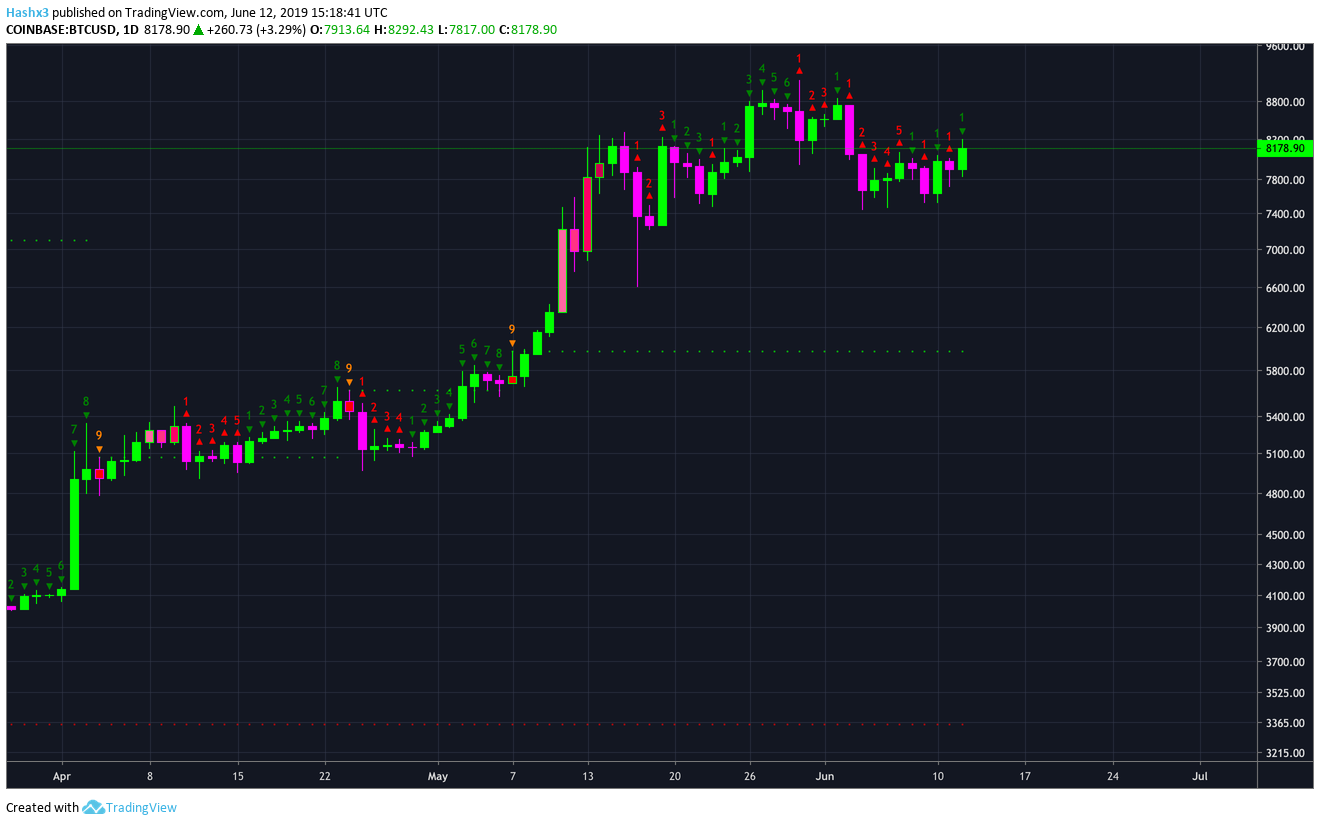
Daily
Bitcoin is currently on a green 1 on the sequential indicator above. When price gives you a green 2 going above a green 1 on the daily chart, it’s an indication to go long (at least in the short-term). If Bitcoin gives us a green 2 tomorrow which also goes above the current consolidation level at $8,050, then a long trade is in play. However, the bulls are still facing harsh resistance at $8.3k, $8.8k, and $9k.
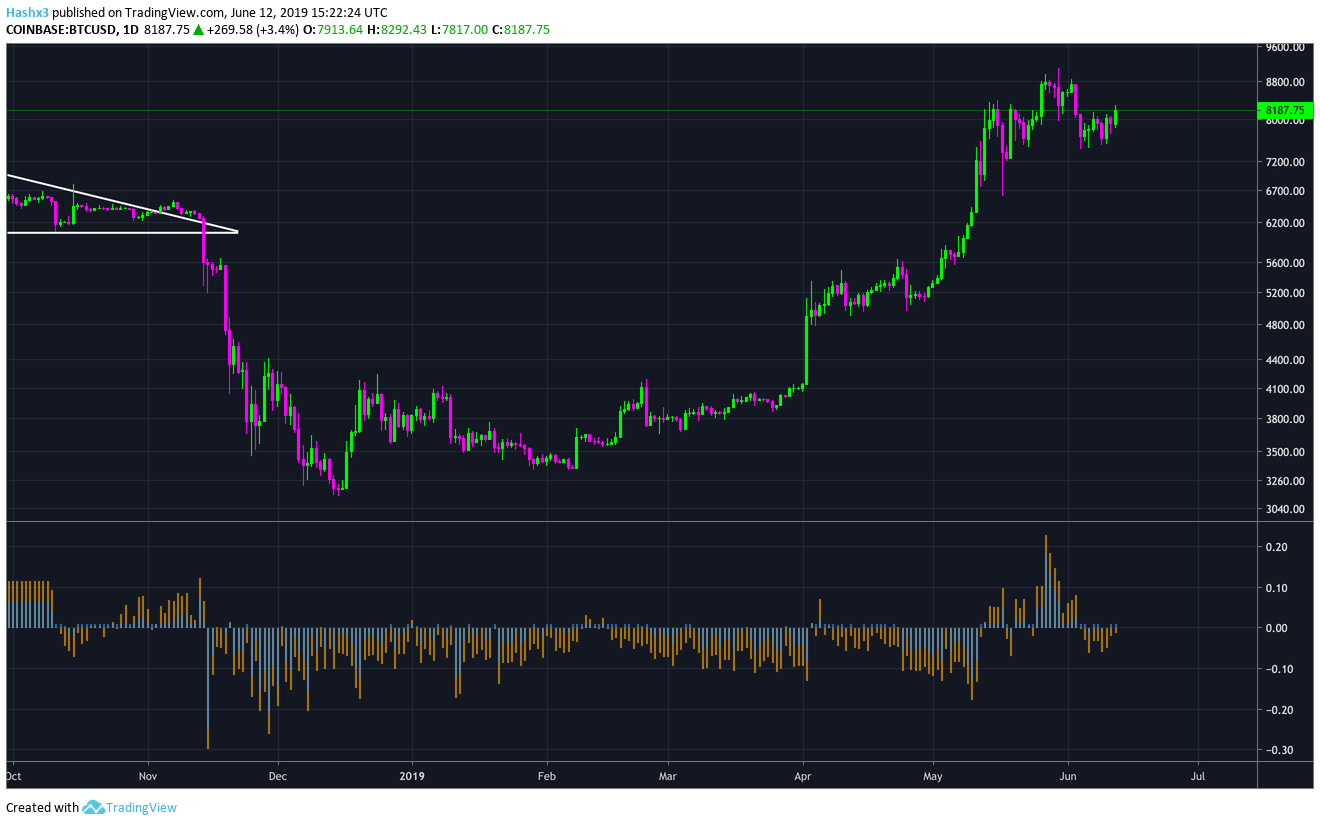
BitMEX Funding and Premium Index
The BitMEX funding and premium index has been a very accurate counter-indicator throughout the entirety of 2018 and 2019. Very recently, it ticked into negative territory which is a bullish signal for the overall market. As you can see in the chart above, Bitcoin’s May rally was predicted by the BitMEX funding and premium index.
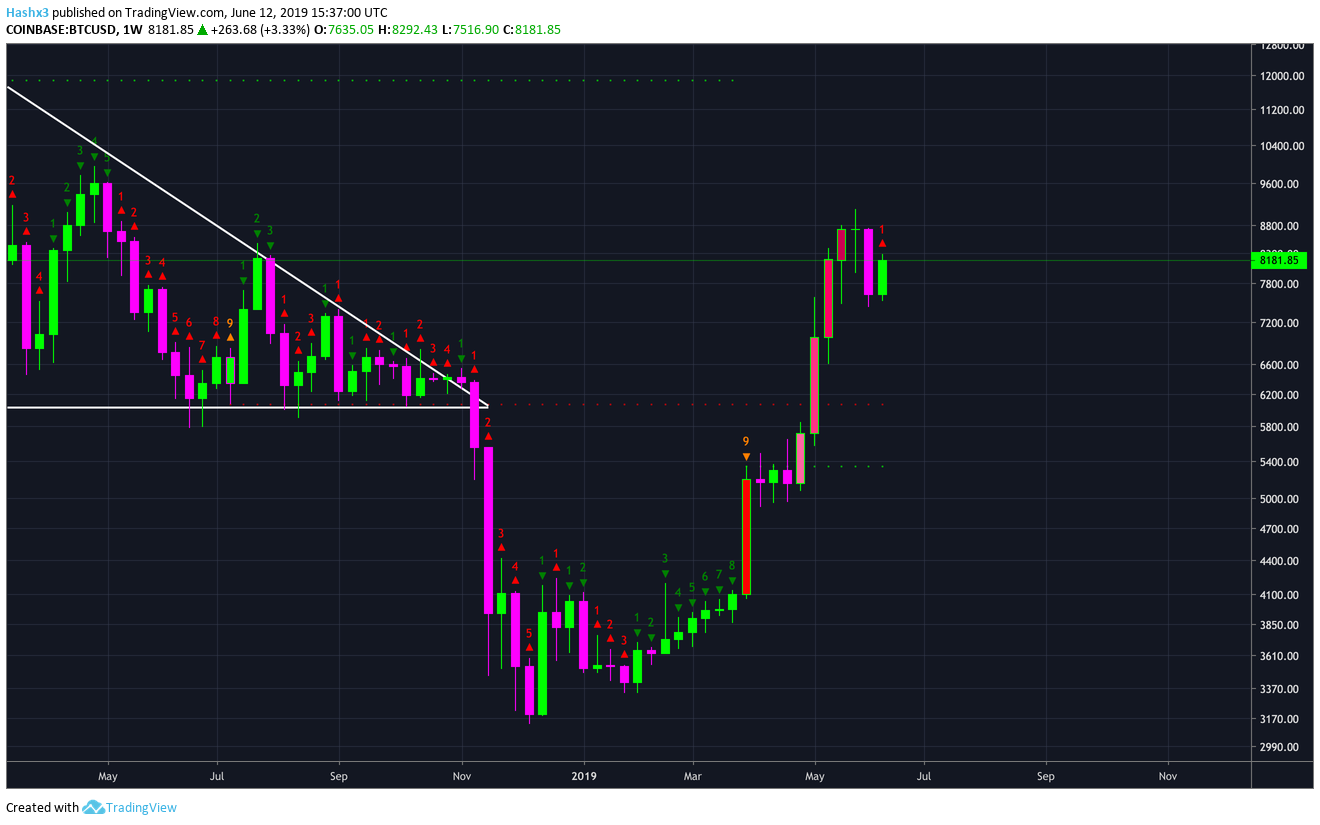
Weekly (Macro)
In previous articles, we have been following the sequential indicator on the weekly chart. As of now, the weekly chart is telling us that Bitcoin is at the start of a 1 to 4 candle correction. Therefore, we should experience 3.5 more weeks of downside or neutral price action.
Cryptocurrency News
Visa is releasing their own blockchain project to increase the efficiency of international settlements. One of the first reactions on crypto Twitter was from Mati Greenspan, Senior Market Analyst at eToro:
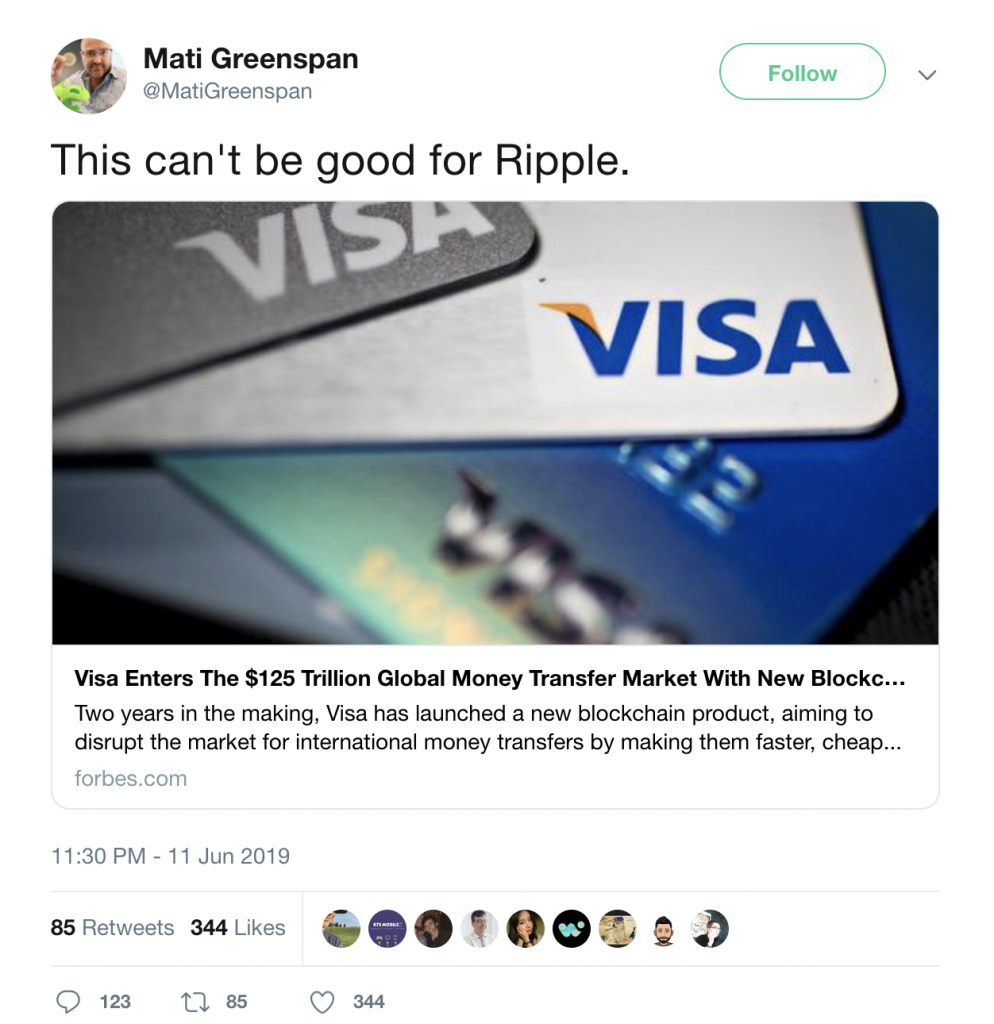
Interestingly enough, the Twitter XRP/Ripple army declared war on Greenspan (who actually holds XRP) in the comments section shortly afterward. According to Visa, they are setting their sights on an enormous market.
“Cross-border, business-to-business (B2B) transactions, where banks transfer money on behalf of corporate customers. Visa says they’re entering a $125 trillion market and using distributed ledger technology—software where transactions must be confirmed by multiple computers on a network to be considered final—to make these payments faster, cheaper and more transparent.”
This is an obvious problem for Ripple. Now they have a direct market competitor with more established connections, more resources, and more notoriety. Additionally, Visa’s blockchain doesn’t have a publicly traded token like XRP, therefore, Visa won’t have to deal with volatility risks the same way Ripple does.
Conclusion
While a pullback is still likely, Bitcoin has begun to exhibit bullish indicators in the short term. On the weekly chart, Bitcoin is still bearish for the next 3.5 weeks. On the other hand, Bitcoin is showing short-term bullish activity. If we get a green 2 going above a green 1 on the daily sequential indicator tomorrow, look to take a long trade. This hypothetical trade also requires a tight stop loss. If a break above $8.3k is confirmed, a retest of $8.8k – $9k seems likely. If price should fall below $7.5k, look for further support at roughly $7.2k and $6.8k.
Disclaimer: The author of the article owns Bitcoin.