
Cryptocurrency
Trading Bitcoin: Bounce From $9k, Now What?
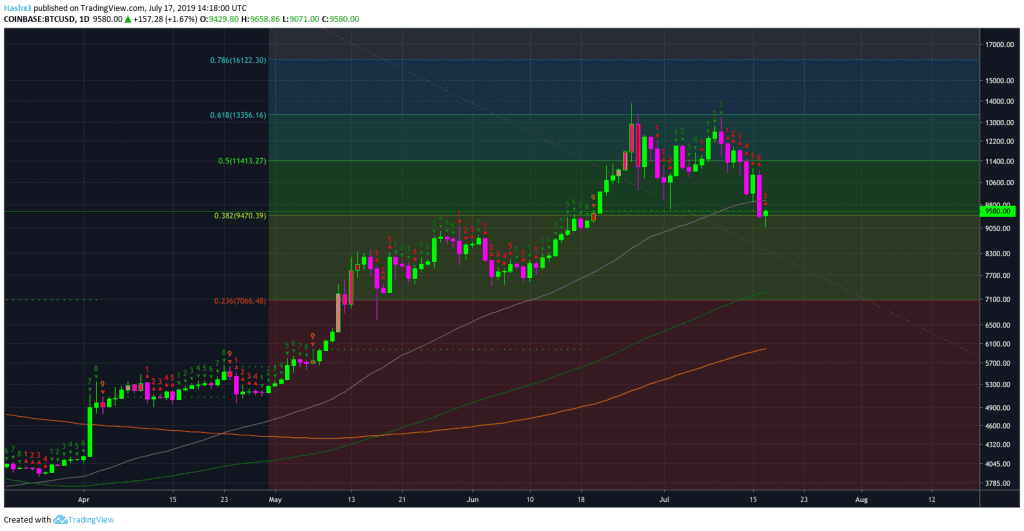
Bounce From $9k Now What? This morning, Bitcoin bounced from $9k after experiencing a heinous downtrend. Currently, price is trading at roughly $9.5k. On the daily chart above, Bitcoin has now closed below the 50MA (gray) and the sequential setup trend line. Theoretically, these levels should now act as resistance at roughly $9.7k – $10k. […]
Bounce From $9k Now What?
This morning, Bitcoin bounced from $9k after experiencing a heinous downtrend. Currently, price is trading at roughly $9.5k. On the daily chart above, Bitcoin has now closed below the 50MA (gray) and the sequential setup trend line. Theoretically, these levels should now act as resistance at roughly $9.7k – $10k. In addition, Bitcoin is barely holding support at the 0.382 fibonacci level. If this level fails to hold, Bitcoin has no established support levels until the 128MA (green) at $7.2k. If price closes below the 0.382 fibonacci level, the trend will become even more bearish. Also, the sequential indicator is currently on a red 7 of 9 candle, which tells us price will likely be bullish for the next two days until the beginning of a new sequence.
4 Hour
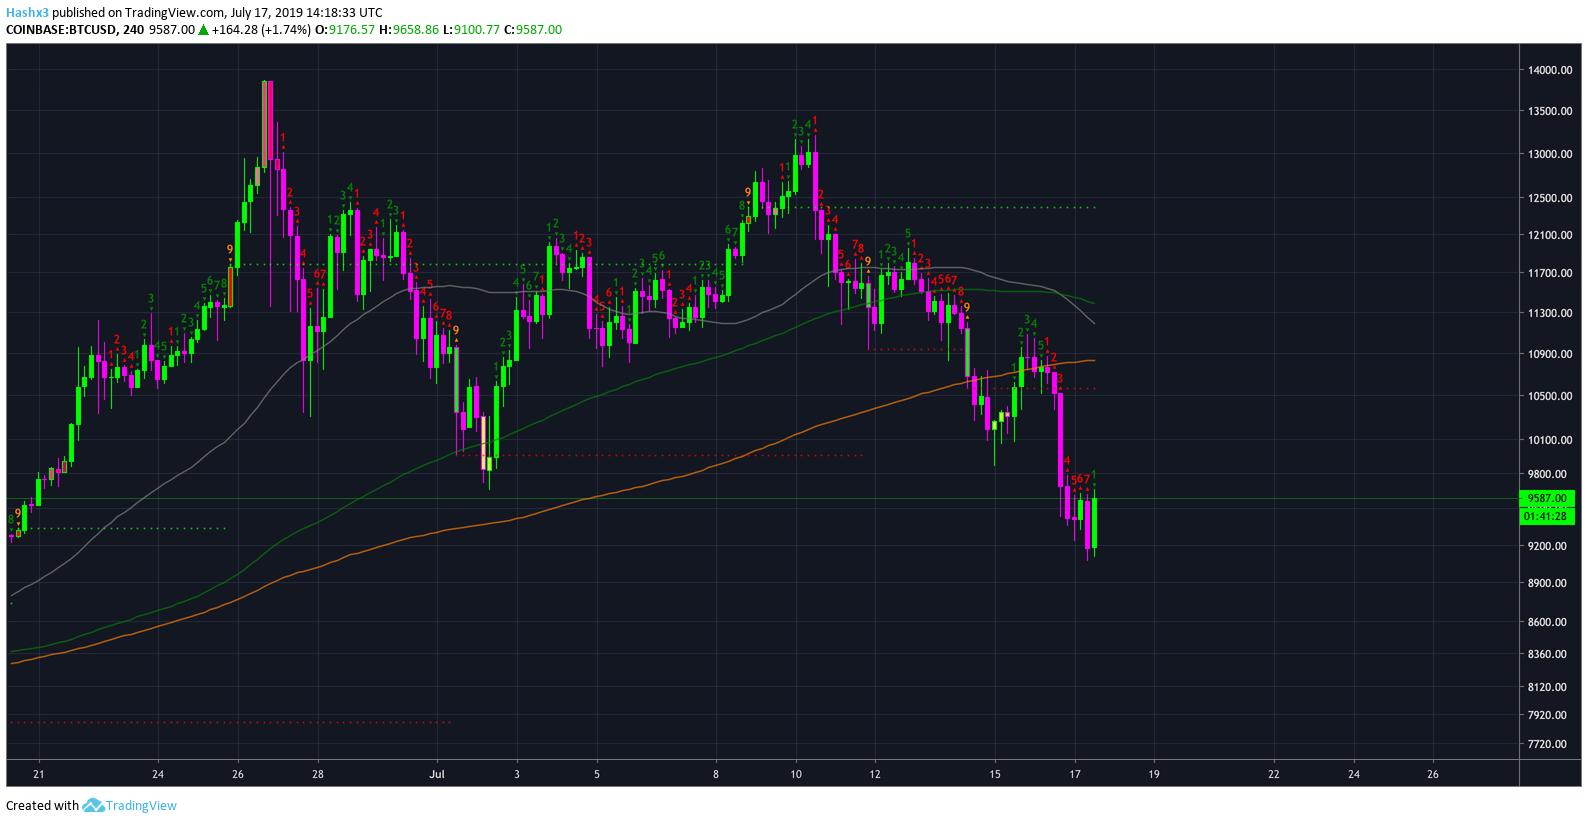
Within the last 4 hour candle, price has bounced to the $9.5k price region. The sequential indicator on the 4 hour chart has just undergone a price flip into a green 1. According to sequential theory, a green or red 1 is considered a no-trade zone. For the bulls, it is better to wait for a green 2 closing above a green 1 to initiate a long trade. For the bears, it is better to wait for a red 2 closing below a red 1 to initiate a short trade. As of now, the 4 hour chart remains in a bearish no-trade zone.
Litecoin / Bitcoin
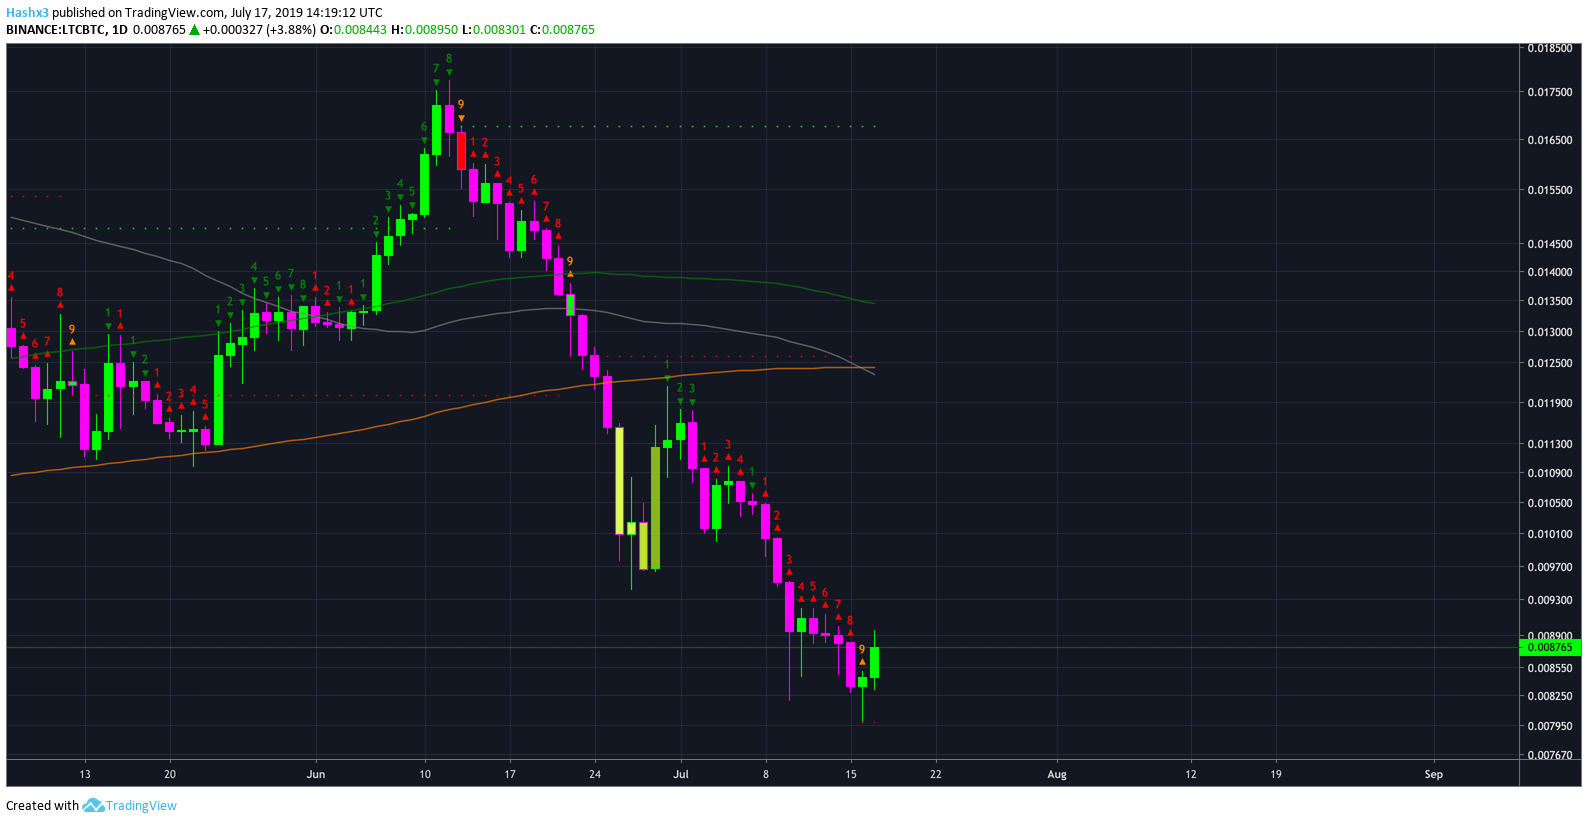
In yesterday’s article we analyzed Litecoin’s performance relative to Bitcoin. As you can see on the chart above, the sequential indicator recently reached a red 9 on a doji-ish candle. According to sequential theory, yesterday was a perfect signal to ‘catch a falling knife’. From a purely technical perspective, sequential would have told you to place a long trade with a tight stop loss.
Conclusion
Bitcoin’s trend structure remains bearish. If price closes below the critical support level at $9.5k the bulls will be in trouble.