
Fundamentals
Candlestick Charts
To help with trading and timing decisions, traders often turn to technical analysis and candlestick charting. So, what are candlestick charts, and why are they so beneficial?
Candlestick charting provides two main benefits. First, candlesticks provide an easier way to see the open, high, low, and close for the day. Second, and more important, certain patterns show indecision from traders and are potential reversal patterns.
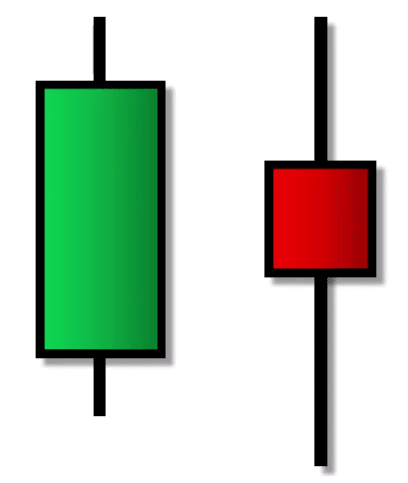
Here are a couple of candlesticks, and it’s easy to see why they’re called candlesticks. But what exactly are they showing, and how do you read them?
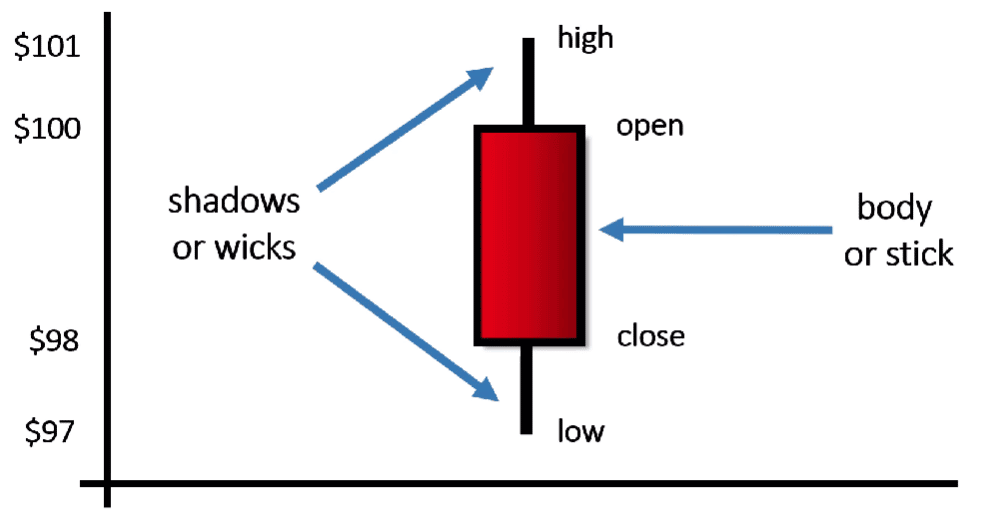
If we were to draw a candlestick by hand, here’s how we’d do it. Let’s say the stock opens at $100, so we just draw a horizontal line at $100. Let’s say the stock closes at $98. To mark that, we draw another horizontal line at $98 to represent the closing price. Next, we’d connect these opening and closing prices to create a rectangle. In this example, the closing price is below the opening price, so we’d shade the candle in red.
Next, we need to mark the high and low trades for the day. If the high was $101, we draw a vertical line up to $101, and if the low was $97, we draw a line down to $97. And there is the candlestick. These vertical lines are called shadows although sometimes you’ll hear them called wicks. The rectangular portion is called the body or the stick.
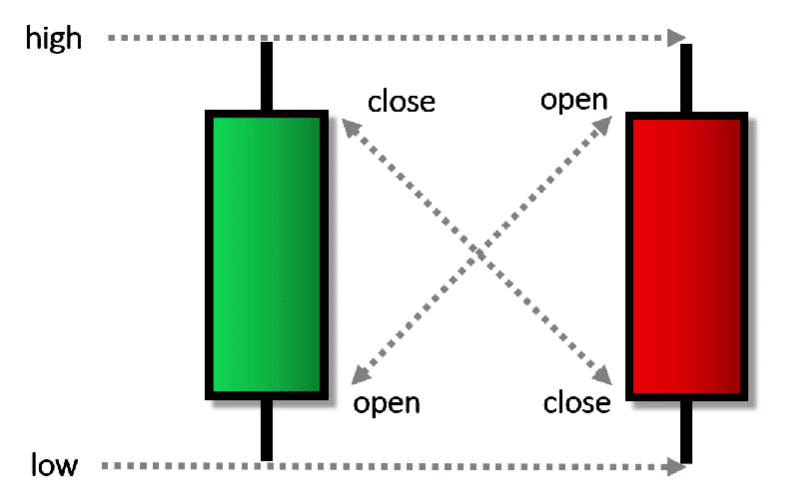
Now, if the opening and closing prices were reversed, so that the close was above the open, we’d shade the candle in green. Whether candlesticks are red or green, the high and low always have the same meaning. The upper shadow always points to the high while the lower shadow always points to the low. However, the diagonals are different. For a green candle the top of the body is the close while the bottom of a red body is the close. Going in the other direction, the bottom of a green candle is the open while the top of a red candle is the open.
So, why use this strange format? Well, candlesticks are much easier to read than the traditional Western Bar chart.
Candlestick Charts vs. Western Bar Charts
For the U.S., the Western Bar chart is a common chart style. Western Bar charts provide identical information as candlesticks, but they’re more difficult to read!
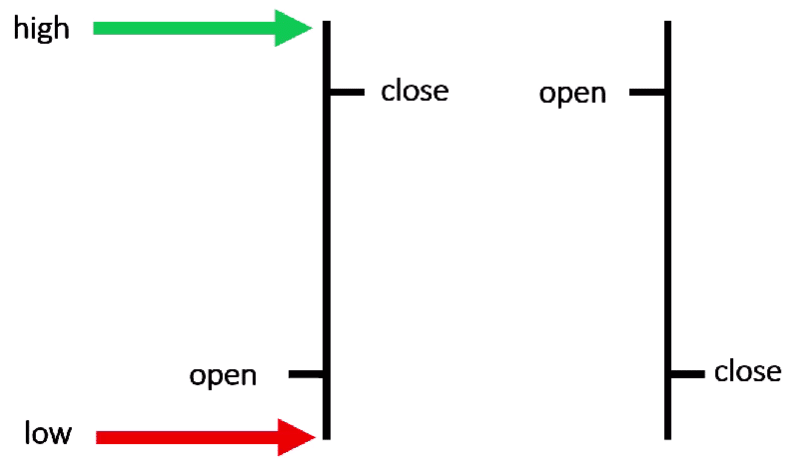
For instance, here are a couple of Western Bars. The first is an “up” day where prices closed higher, while the second is a “down” day where prices closed lower. But it’s not so easy to tell by using Western Bars. Just as with candlesticks, the top of the line marks the high while the bottom of the line marks the low. However, it’s these little hash marks that designate the open and close. If the hash mark is to the left of the line, it’s an opening price, and if the hash mark is to the right, it’s a closing price.
The second bar is a “down,” day and you can tell because the hash mark on the left is the opening price while the hash mark to the right is the closing price. Because the close is lower than the open, it shows that prices were down. But it’s not as easy to see if prices were up or down compared to when you’re using candlesticks.
Let’s compare these two Western Bars to their corresponding candlesticks.
Here’s the Western Bar we saw on the previous slide. And here’s the corresponding candlestick. It’s much easier to see that prices were up for the day. Here’s the Western Bar we saw for the down day on the previous slide and here’s the corresponding candlestick. Once again, it’s immediately obvious that prices were down since the candle is red.
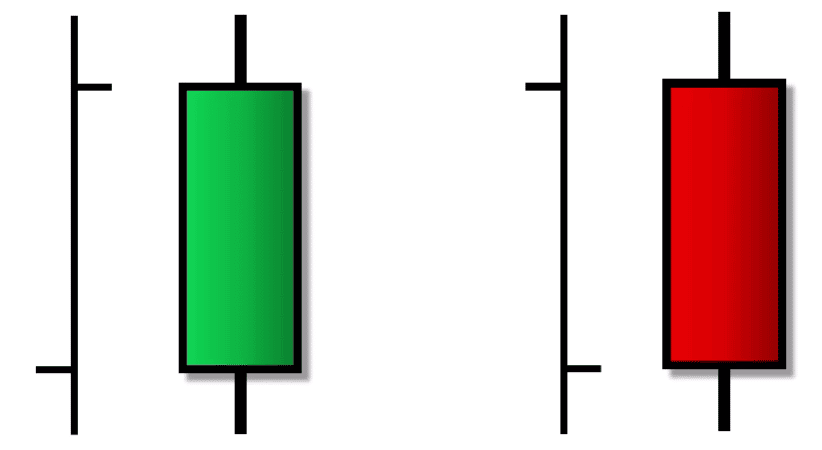
Whether the candle is green or red, it’s also easier to see the opening and closing prices because of the nice rectangular body. So, it’s not that candlesticks convey more information than a Western Bar. Instead, they just make it easier to see. And when price action is easier to see, it’s easier to use technical analysis to make decisions.
While candlesticks make it easier to interpret a lot of information, there are some things the candlesticks don’t show. First, candlesticks don’t show the price action during the day. If two stocks share the same open, high, low, and close, you’ll get identical candles. So, that means an infinite number of stock price paths can produce identical candles.
For instance, let’s say one stock (shown in red) opens for trading at $100, and has this price path through the trading day. A second stock (shown in blue) also opens at $100 but has a different path throughout the trading day. A third stock (shown in green) also begins at $100 but has a very different, more volatile, path during the day.
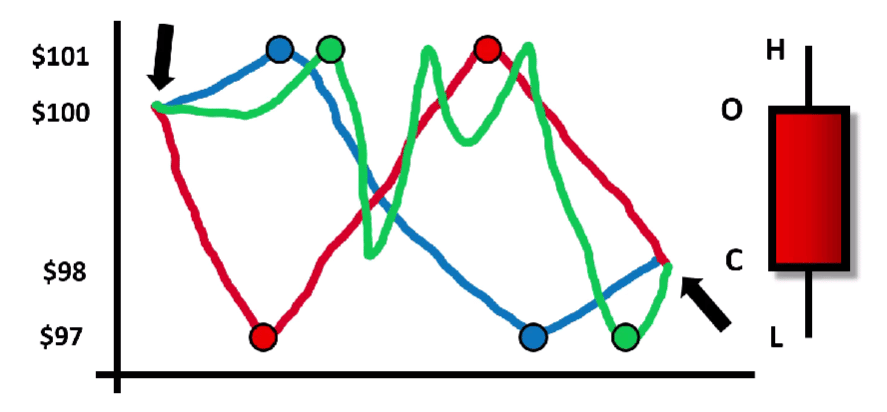
Notice that all three stocks started at $100, all had the same high, all had the same low, and all had the same closing price. And because of that, all three stocks will have the identical candle at the end of the day. So remember, a daily candle doesn’t show you the price action throughout the trading day, it just shows the open, high, low, and close in a much friendlier format.
Candlestick Patterns
Perhaps the biggest advantage of candlesticks is that there are many patterns that can show potential reversal points. And because of the way the candlesticks are drawn, it makes it easier to see these patterns when looking at charts.
A commonly occurring pattern is called a Doji, and it looks like a “plus” sign. For example, let’s say we see a stock price running aggressively higher, but the next day, we get this plus-sign shape as our candlestick. Notice there’s no body and no color—it’s not red or green. Instead, the body shows up as a single horizontal line, which shows the opening and closing prices were the same. Even if the opening and closing prices aren’t exactly the same, as long as you get a candle that looks like this plus-sign shape, it’s a type of Doji.
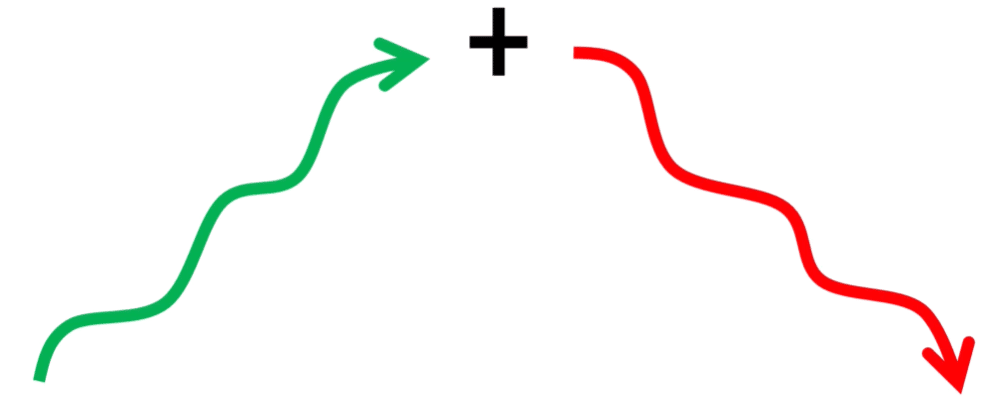
Notice too that the shadows don’t cover a large range, which shows there wasn’t a lot of movement from the low to the high. The interpretation is that investors were starting to become cautious after such an aggressive price increase. The bulls were reluctant to push prices higher, and the bears were reluctant to push prices lower. At the end of the trading session, prices closed right where they opened, or at least very close. Because this Doji occurred after a large run up, it’s quite common to see it followed by a reversal to the downside. A Doji at the bottom would have the opposite interpretation.
Here’s an actual price chart of Boeing (BA):
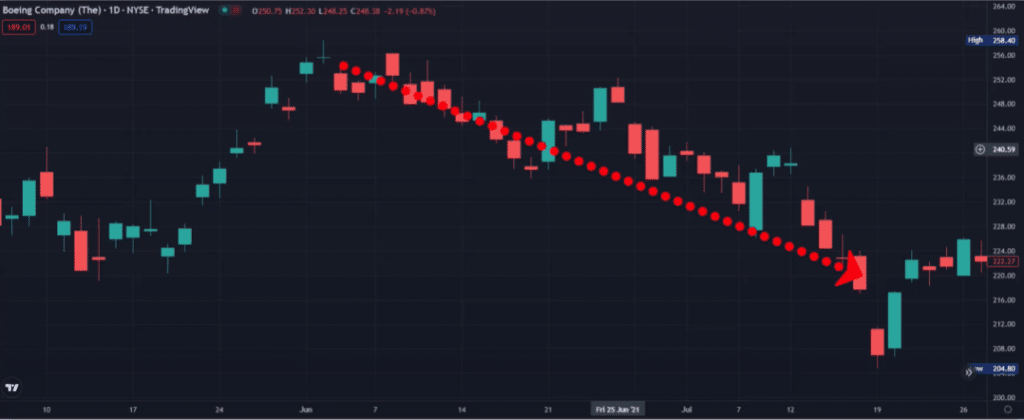
You can see that after this aggressive run up, we got a type of Doji which showed that investors were starting to become cautious. So, if there aren’t a lot of buyers continuing to push prices higher, it implies we may be at a reversal point. And as you can see, prices did drop sharply.
Another common candlestick pattern is called an engulfing pattern. If it occurs at the top of an aggressive run, it’s called a bearish engulfing. For example, let’s say we had an aggressive rise in prices. The next day, we got a green candle, which makes it look like prices would continue running higher. However, the next day we get this red candle. Notice that this second candle’s size completely overshadows or “engulfs” the previous day’s candle.
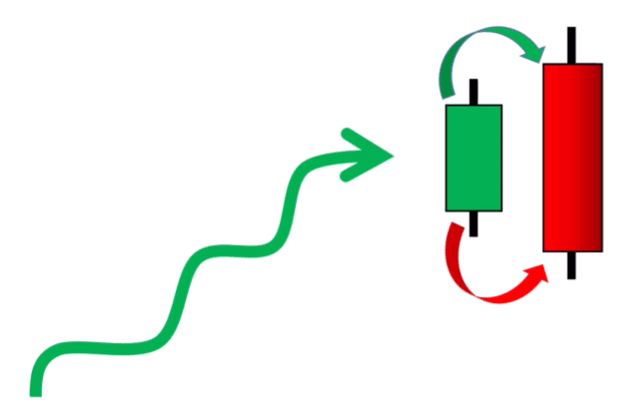
For this pattern to occur, notice the price had to gap up on the opening bell, which makes it appear that prices would continue rising. However, investor sentiment switched during the day. And that’s what caused the closing price to fall below yesterday’s opening. There was a big reversal in demand, and that’s what makes the second candle completely engulf the previous day’s candle. So, when you see and engulfing pattern at the top, it’s usually a sign of an impending reversal. An engulfing pattern at the bottom would be created in the opposite way and be a bullish engulfing pattern.
Here’s an actual price chart of Adobe (ADBE). Notice this large aggressive run. We got a green candle on this day, which made it appear that prices would continue higher. But the next day, we got a perfect engulfing pattern.
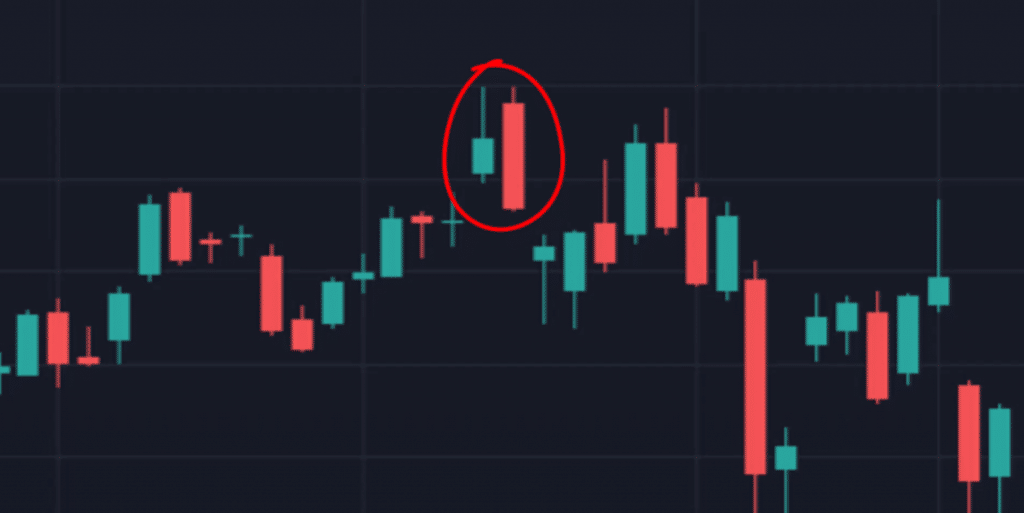
The only way for that pattern to occur is there must have been a shift in the demand for the stock. So, if demand is waning today, there’s no reason you should expect prices to be climbing higher tomorrow. That’s why engulfing patterns at the top of an aggressive run usually show an impending reversal, and you can see the rapid decline right after this engulfing pattern formed. So, just like Doji, engulfing patterns play an important part in candlestick charting.
And you can learn all about options, trading, and candlesticks right here at MarketRebellion.com/education.
For the highlights:
- Candles make it easy to see the open, high, low, and close
- The candle color is found by the opening trade compared to the closing trade
- Candles show great insights into supply and demand
- Traders use candlesticks to determine possible reversal points