
Fundamentals
Option Greeks
Option prices don’t behave like stock prices. If the stock rises one dollar, your call option may not rise one dollar. Also, as time passes, some of your option’s price will decay away, but that won’t happen with shares of stock. Options have different price behaviors from stock, so to monitor this behavior, it helps to understand some mathematical connections, each denoted by a Greek letter, what options traders collectively call the Greeks.
While there are many Greek calculations, the five main Greeks are delta, gamma, theta, vega, and rho. So, let’s start with the first one—delta. As just mentioned, option prices don’t necessarily rise or fall dollar for dollar with the stock’s price. To monitor how the option’s price will respond to changes in the stock’s price, options traders watch a mathematical connection called delta.
Options Delta
Delta shows by how much the option’s price will change for the next one-dollar change in the stock’s price. It’s important to realize that delta only counts for the next dollar move. After that, all Greek measures will change, including delta. In other words, as the stock price changes, time passes, or volatility changes, all of these Greeks will change.
To understand delta, let’s start with shares of stock. Remember, the risk graph for stock is always a straight line. If the stock rises one dollar, you make one dollar. If we divide the one dollar gain by the one dollar change in the stock’s price, we get one—and that’s delta. Conversely, if the stock falls one dollar, you’d lose one dollar, which is also a delta of one. For shares of stock, the delta is always one, which shows that you make—or lose—dollar for dollar with changes in the stock’s price. Positive delta positions make money as the stock price rises and lose money as it falls.
Short shares work just in just the opposite way. If the stock falls one dollar, a short stock position makes one dollar. If you divide the one dollar gain by the minus one dollar move, we get negative one, so short shares of stock positions have a delta of negative one. That just means you make a one dollar gain for each dollar fall in the stock’s price, and you lose one dollar for each dollar rise in the stock’s price. Notice that negative deltas move in the opposite direction. Negative delta positions make money as the stock price falls and lose money as the stock price rises.
Option prices don’t respond in the same way. Here’s the risk graph for a $100 call. Remember that an option’s risk graph has two curves: the black curve is the expiration graph, but the blue curve is the current curve, which shows the option’s value today.
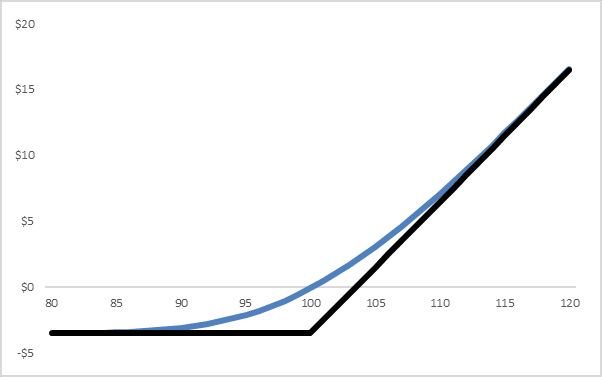
Notice that the current graph isn’t a straight line—it’s curved. And because of that the option’s delta isn’t always equal to one. For example, if the option is out of the money, say with a stock price near $90, the option’s delta will be very low, perhaps 0.10. However, because each contract controls 100 shares, most traders just say it has a delta of 10. That means if the stock quickly rises from $90 to $91, this option’s price will pick up only 10 cents, or 10% of that stock price move. If the stock’s price is near $95, the delta may rise to 30. If an option is at the money, the delta will be close to 50. Once the option goes in the money, the delta will rise above 50, so if the stock is $105, the delta may rise to 70. Finally, if the option is deep in the money, say with a stock price near $115, the option’s delta may be one. Only at that stock price or higher will the option’s price rise dollar for dollar.
For example, let’s say a stock is trading for $100, the $100 call is trading for $3, and your broker’s platform shows the option has a delta of 50. This means if the stock quickly rises one dollar to $101, this option’s price will pick up 50% of that move, or 50 cents, and rise from $3 to $3.50. On the other hand, if the stock’s price quickly falls one dollar to $99, the option’s price will fall 50 cents to $2.50. Delta only counts if the stock makes a quick move from the price right now. If too much time passes, time decay kicks in, and the delta won’t be the same. So, just because your broker’s platform may show a delta of 50 right now, it doesn’t mean the option always has that delta. It’s just at that moment.
On the other hand, let’s say the broker’s platform said the delta was, instead, 70. If the stock quickly rises one dollar to $101, this option’s price will pick up 70%, or 70 cents, and rise from $3 to $3.70. On the other hand, if the stock’s price quickly falls one dollar to $99, the option’s price will fall 70 cents to $2.30. So those are the basics of delta, what is gamma?
Options Gamma
Gamma is similar to delta, but rather than showing the change in the option’s price, it shows by how much the option’s delta will change for a one-dollar change in the stock’s price. Consequently, gamma is sometimes called the delta of the delta. Remember, as the stock’s price changes or time passes, or volatility changes, all of the Greeks change. Gamma shows by how much your delta will change.
For example, let’s say the stock is $100 and your option’s delta is 50, but if the stock rises to $101, the option’s delta may jump to 55, the option’s gamma is five. Gamma shows your option’s delta will increase by five deltas for the next dollar move in the stock. Let’s now move to the next Greek—theta.
Options Theta
Theta shows by how much the option’s price will change for one day’s passage of time. Because options have an expiration date, they lose a little bit of extrinsic value each day. Theta shows how much value the option will lose. For instance, the current curve in blue may be at this position with 30 days until expiration, but as time passes, the line will slowly shift lower.
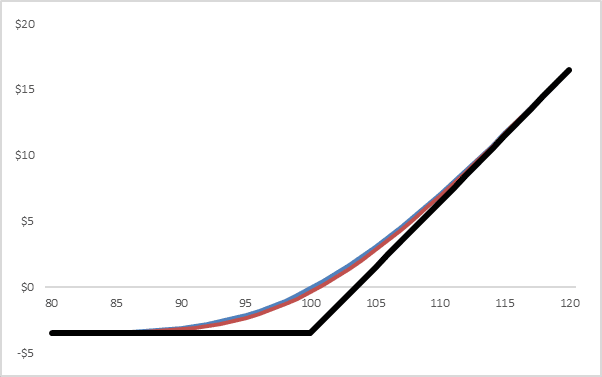
The difference between the two lines shows the amount of value that was lost in the option’s price from one day’s passage of time. With each passing day, the current curve shifts lower, and lower, and lower, and lower. And right at expiration, the current curve becomes the expiration curve. So, if you want to know how much value your option is expected to lose on any given day, look at theta. Let’s now move to the next Greek on the list—vega.
Options Vega
Vega shows by how much the option’s price will change for a one-percentage point change in volatility. For example, if volatility rises from 30% to 31%. That’s a one-percentage point increase in volatility. Also, if volatility falls from 30% to 29%, that would be a one-percentage point decrease in volatility.
For example, let’s say that volatility is 30%, the $100 call is trading for $3, and your broker’s platform shows the vega is .05. If volatility rises one-percentage point from 30% to 31%, the option’s price will increase by vega, or five cents, and rise from $3 to $3.05. On the other hand, if volatility falls one percentage point from 30% to 29%, the option’s price will decrease by vega and fall from $3 to $2.95. The last Greek on the list is rho.
Options Rho
Rho shows by how much the option’s price will change for a one-percentage point change in the risk-free interest rate. For example, if the risk-free rate = 3%. and it instantly rises to 4% or falls to 2%. Those are one-percentage point changes in the risk-free rate. Let’s say the risk-free rate is 3%, the $100 call is trading for $3, and your broker’s platform shows this call has a rho of .02. If the risk-free rate instantly rises one percentage point from 3% to 4%, this option’s price would rise by rho and increase from $3 to $3.02. On the other hand, if the risk-free rate instantly fell from 3% to 2%, the option’s price would lose by rho and fall from $3 to $2.98.
While rho isn’t considered to be terribly important for option’s traders, it’s a bit of a misperception. It’s true that option prices are generally not too sensitive to interest rates, but they certainly can be for longer-dated options or options covering more expensive stocks. Also, for the U.S., the risk-free interest rates are usually increased in quarter-point increments, so the change in your option’s price would be only one-fourth of that predicted by rho. However, if you’re trading currency options in a currency facing runaway inflation, rho can be the most dangerous of all the Greeks.
For the highlights, remember:
- Greeks are sensitivity measures
- Delta shows the option’s sensitivity to changes in the stock’s price
- Gamma shows the option’s delta sensitivity
- Theta shows the option’s sensitivity to time
- Vega shows the option’s sensitivity to volatility
- Rho shows the option’s sensitivity to interest rates.
- Option prices are constantly changing as the stock price, time, and volatility are changing. And that means the Greeks are critical for making decisions.